The Architecture Behind A One-Person Tech Startup
Sep 12, 2023 (updated)@anthonynsimon
Update: since I wrote this article, Panelbear has been acquired and I've simplified my stack. In particular, instead of Kubernetes I now use Kamal to deploy my apps. You can read more about it here.
This is a long-form post breaking down the setup I use to run a SaaS. From load balancing to cron job monitoring to payments and subscriptions. There's a lot of ground to cover, so buckle up!
As grandiose as the title of this article might sound, I should clarify we’re talking about a low-stress, one-person company that I run from my flat. It's fully self-funded, and I like to take things slow. It's probably not what most people imagine when I say "tech startup".
I use Kubernetes on AWS, but don’t fall into the trap of thinking you need this. I learned these tools over several years mentored by a very patient team. These tools work well for me, but they might not be the right fit for you.
By the way, I drew inspiration for the format of this post from Wenbin Fang’s blog post. I really enjoyed reading his article, and you might want to check it out too!
With that said, let's jump right into the tour.
Table of contents
- A bird’s eye view
- Automatic DNS, SSL, and Load Balancing
- Automated rollouts and rollbacks
- Let it crash
- Horizontal autoscaling
- Static assets cached by CDN
- Application data caching
- Per endpoint rate-limiting
- App administration
- Running scheduled jobs
- App configuration
- Keeping secrets
- Relational data: Postgres
- Columnar data: ClickHouse
- DNS-based service discovery
- Version-controlled infrastructure
- Terraform for cloud resources
- Kubernetes manifests for app deployments
- Subscriptions and Payments
- Logging
- Monitoring and alerting
- Error tracking
- Profiling and other goodies
- That's all folks
A bird’s eye view
My infrastructure handles multiple projects at once, but to illustrate things I’ll use my most recent SaaS, a web performance and traffic analytics tool, as a real-world example of this setup in action.
 Browser Timings chart in Panelbear, the example project I'll use for this tour.
From a technical point of view, this SaaS processes a large amount of requests per second from anywhere in the world, and stores the data in an efficient format for real time querying.
Business-wise it's still in its infancy (I launched six months ago update: it's been acquired), but it has grown rather quickly for my own expectations, especially as I originally built it for myself as a Django app using SQLite on a single tiny VPS. For my goals at the time, it worked just fine and I could have probably pushed that model quite far.
However, I grew increasingly frustrated having to reimplement a lot of the tooling I was so accustomed to: zero downtime deploys, autoscaling, health checks, automatic DNS / TLS / ingress rules, and so on. Kubernetes spoiled me, I was used to dealing with higher level abstractions, while retaining control and flexibility.
Fast forward six months, a couple of iterations, and even though my current setup is still a Django monolith, I'm now using Postgres as the app DB, ClickHouse for analytics data, and Redis for caching. I also use Celery for scheduled tasks, and a custom event queue for buffering writes. I run most of these things on a managed Kubernetes cluster (EKS).
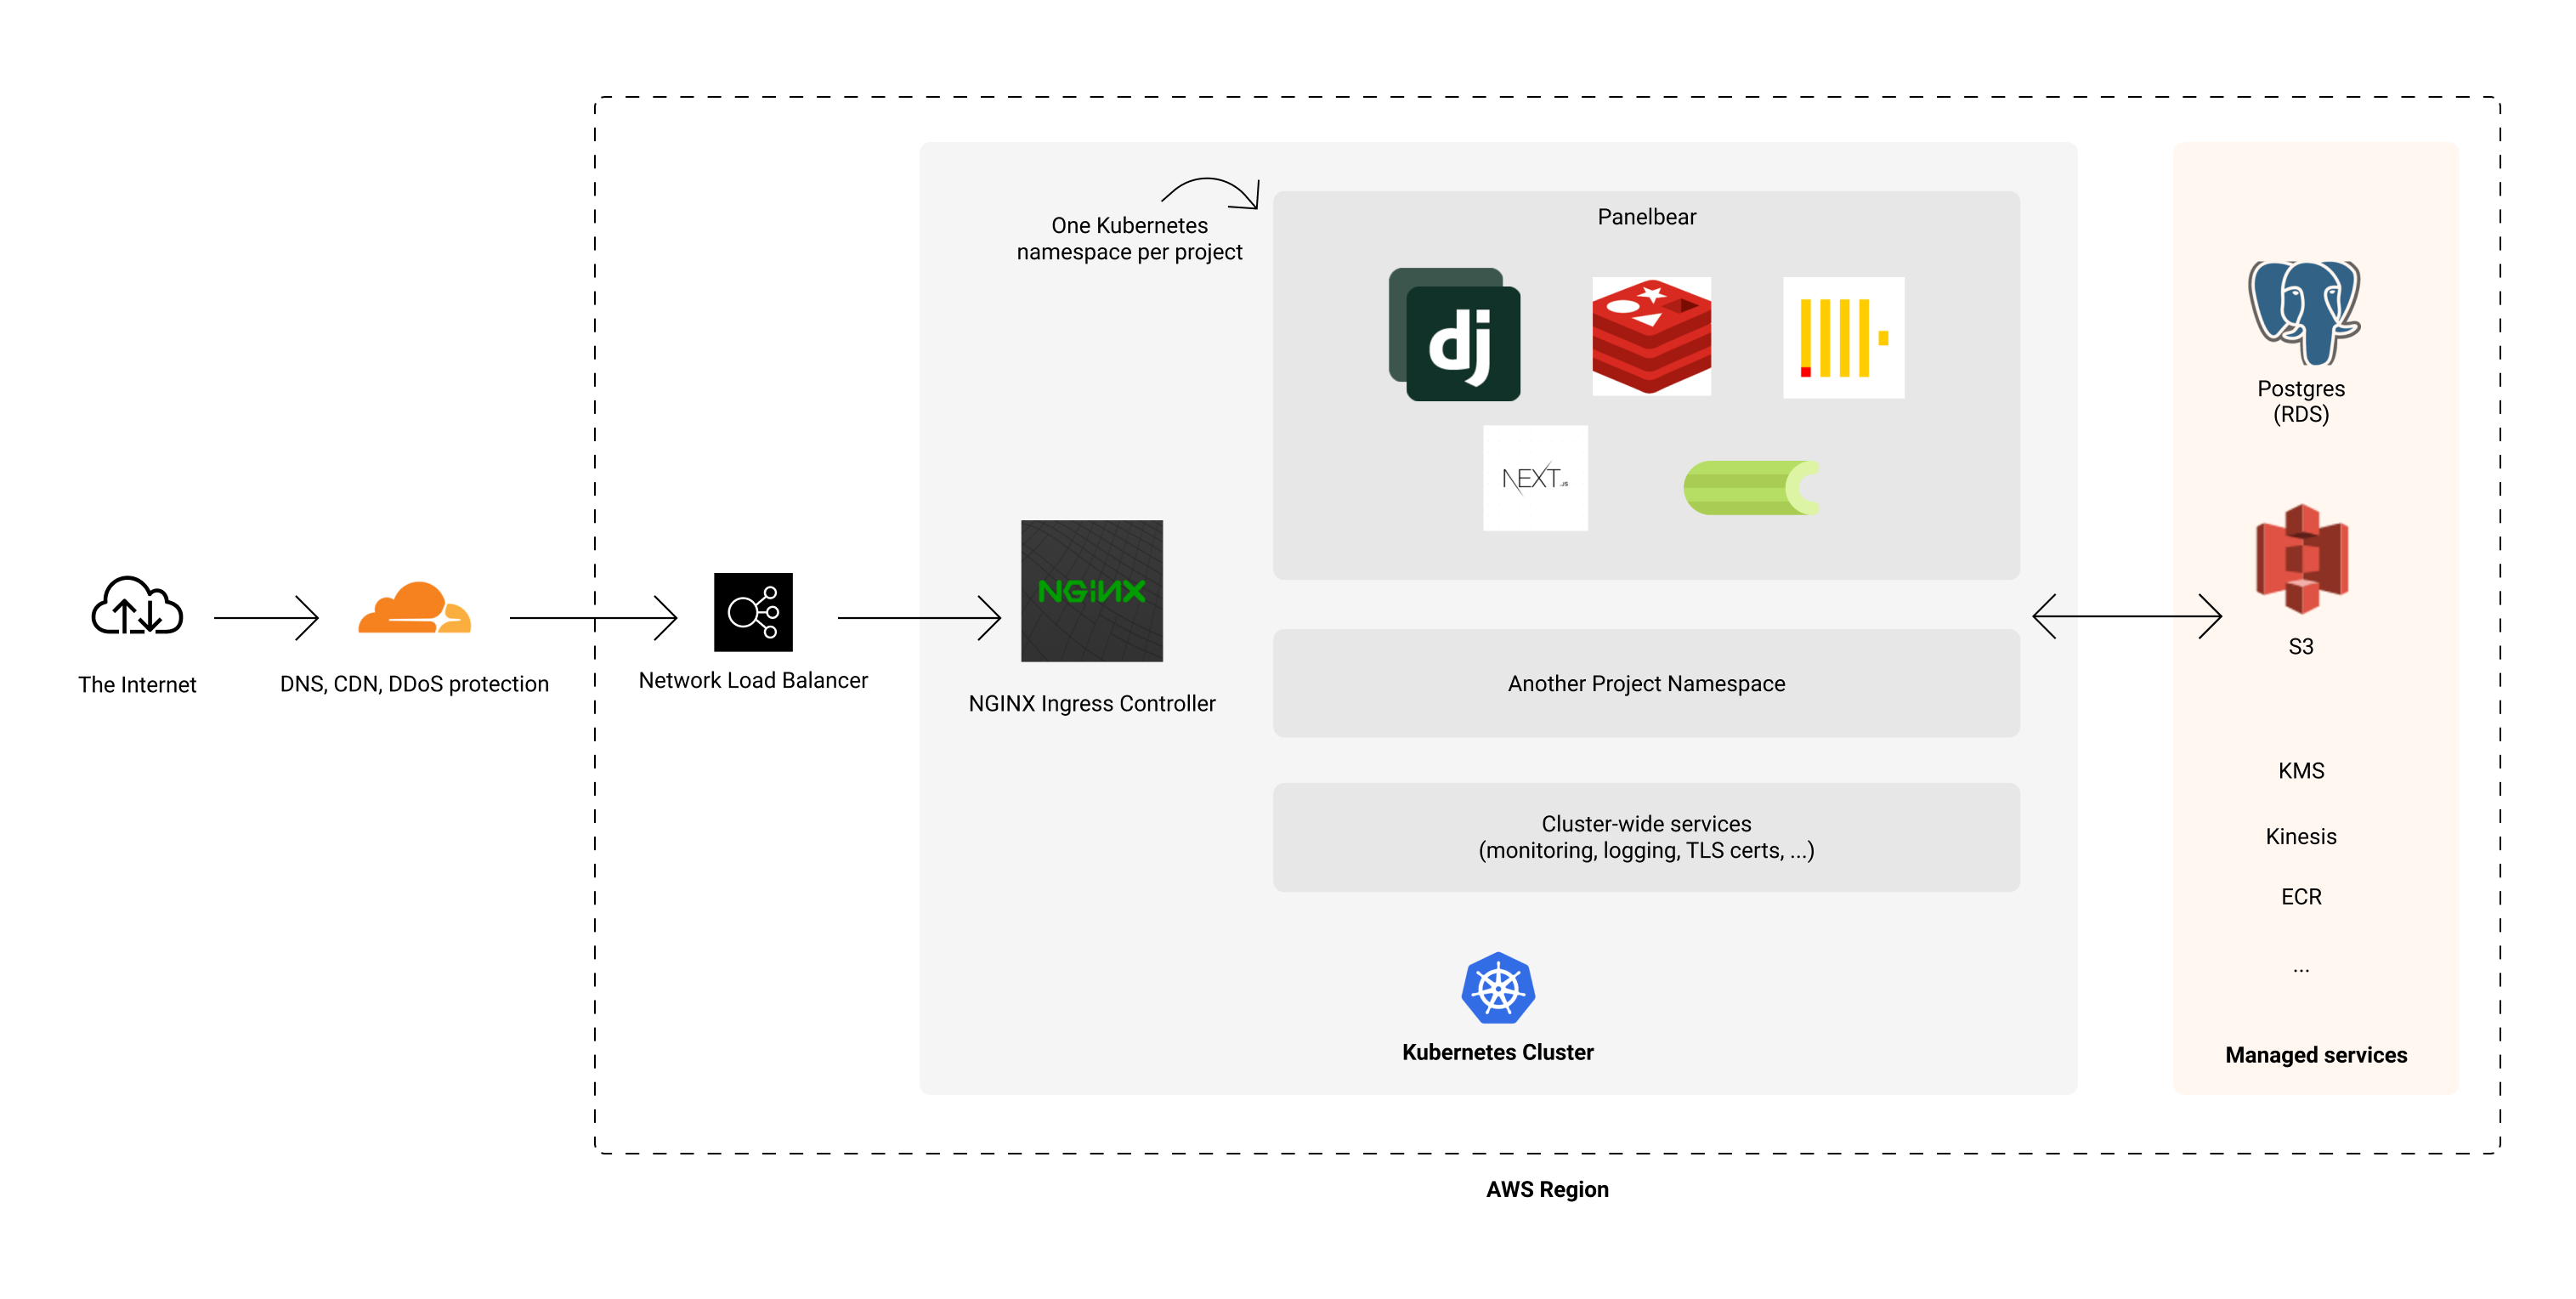 A high-level overview of the architecture.
It may sound complicated, but it's practically an old-school monolithic architecture running on Kubernetes. Replace Django with Rails or Laravel and you know what I'm talking about. The interesting part is how everything is glued together and automated: autoscaling, ingress, TLS certificates, failover, logging, monitoring, and so on.
It's worth noting I use this setup across multiple projects, which helps keep my costs down and launch experiments really easily (write a Dockerfile and git push). And since I get asked this a lot: contrary to what you might be thinking, I actually spend very little time managing the infrastructure, usually 0-2 hours per month total. Most of my time is spent developing features, doing customer support, and growing the business.
That said, these are the tools I’ve been using for several years now and I’m pretty familiar with them. I consider my setup simple for what it’s capable of, but it took many years of production fires at my day job to get here. So I won’t say it’s all sunshine and roses.
I don't know who said it first, but what I tell my friends is: "Kubernetes makes the simple stuff complex, but it also makes the complex stuff simpler".
Automatic DNS, SSL, and Load Balancing
Now that you know I have a managed Kubernetes cluster on AWS and I run various projects in it, let's make the first stop of the tour: how to get traffic into the cluster.
My cluster is in a private network, so you won’t be able to reach it directly from the public internet. There’s a couple of pieces in between that control access and load balance traffic to the cluster.
Essentially, I have Cloudflare proxying all traffic to an NLB (AWS L4 Network Load Balancer). This Load Balancer is the bridge between the public internet and my private network. Once it receives a request, it forwards it to one of the Kubernetes cluster nodes. These nodes are in private subnets spread across multiple availability zones in AWS. It's all managed by the way, but more on that later.
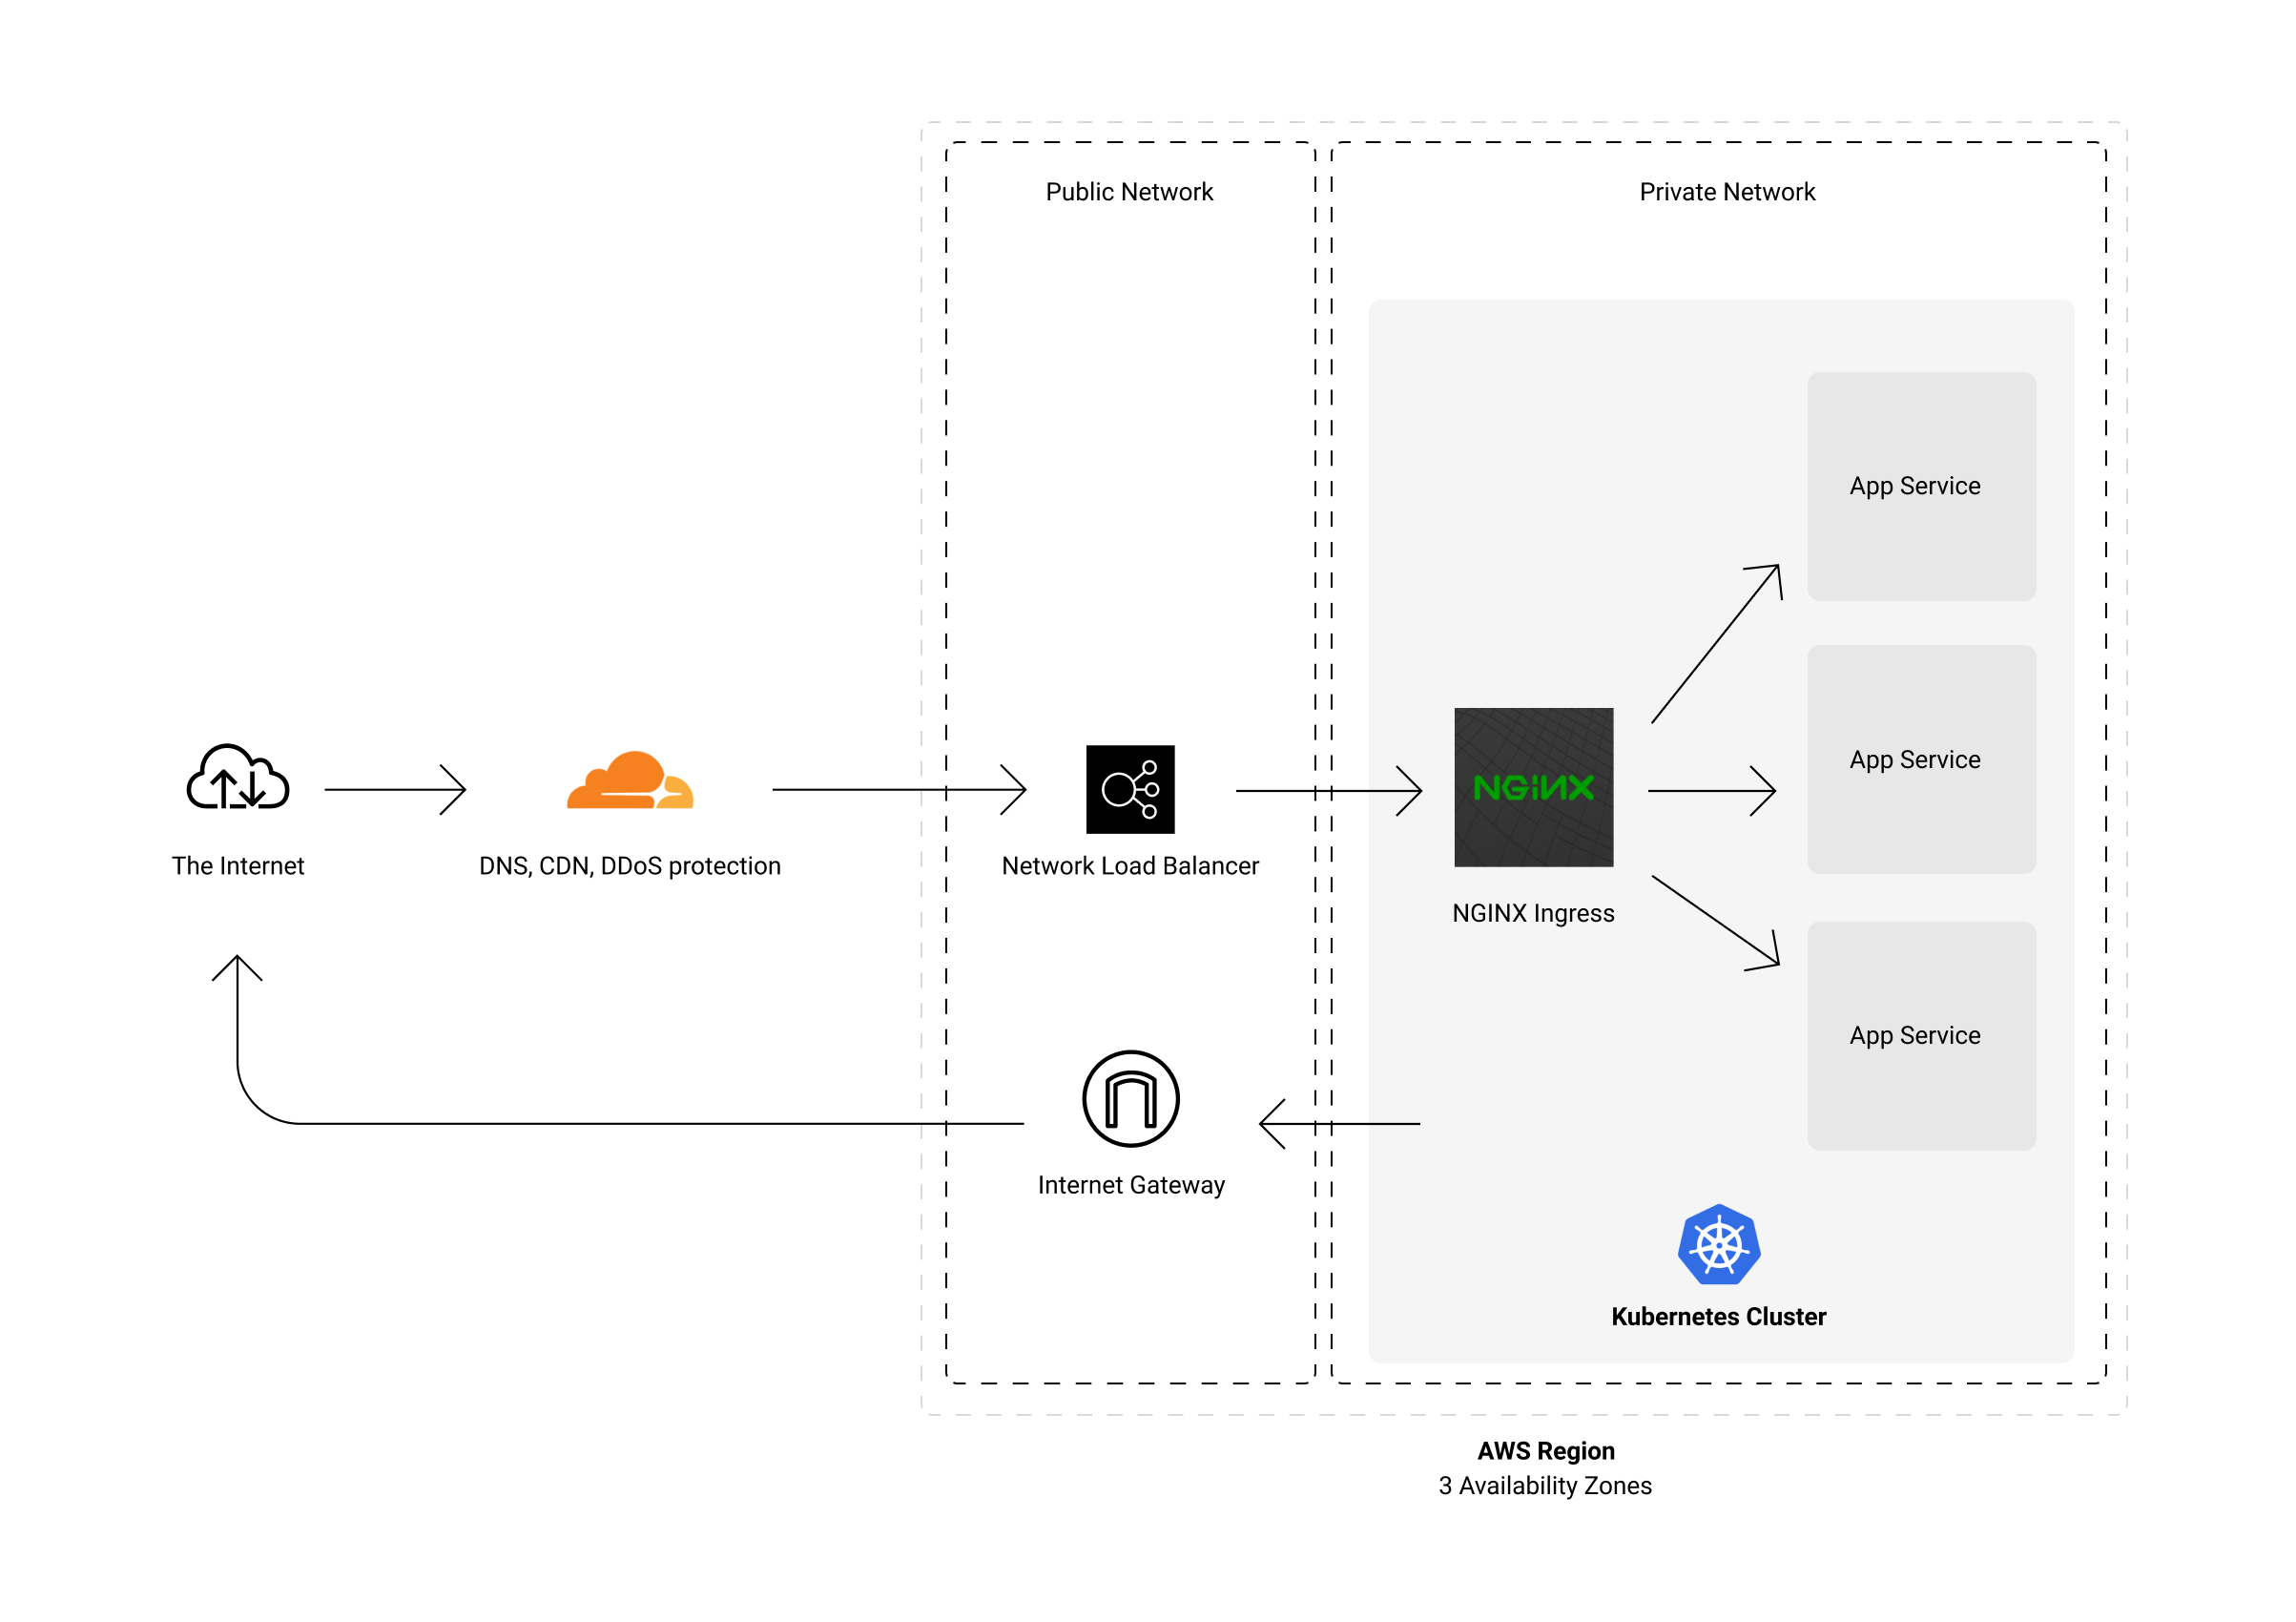 Traffic gets cached at the edge, or forwarded to the AWS region where I operate.
"But how does Kubernetes know which service to forward the request to?" - That’s where ingress-nginx comes in. In short: it's an NGINX cluster managed by Kubernetes, and it's the entrypoint for all traffic inside the cluster.
NGINX applies rate-limiting and other traffic shaping rules I define before sending the request to the corresponding app container. In Panelbear’s case, the app container is Django being served by Uvicorn.
It's not much different from a traditional nginx/gunicorn/Django in a VPS approach, with added horizontal scaling benefits and an automated CDN setup. It’s also a “setup once and forget” kind of thing, mostly a few files between Terraform/Kubernetes, and it’s shared by all deployed projects.
When I deploy a new project, it’s essentially 20 lines of ingress configuration and that’s it:
apiVersion: networking.k8s.io/v1beta1
kind: Ingress
metadata:
 namespace: example
 name: example-api
annotations:
 kubernetes.io/ingress.class: "nginx"
 nginx.ingress.kubernetes.io/limit-rpm: "5000"
 cert-manager.io/cluster-issuer: "letsencrypt-prod"
 external-dns.alpha.kubernetes.io/cloudflare-proxied: "true"
spec:
tls:
- hosts:
   - api.example.com
 secretName: example-api-tls
rules:
- host: api.example.com
 http:
   paths:
     - path: /
       backend:
         serviceName: example-api
         servicePort: http
Those annotations describe that I want a DNS record, with traffic proxied by Cloudflare, a TLS certificate via letsencrypt, and that it should rate-limit the requests per minute by IP before forwarding the request to my app.
Kubernetes takes care of making those infra changes to reflect the desired state. It’s a little verbose, but it works well in practice.
Automated rollouts and rollbacks
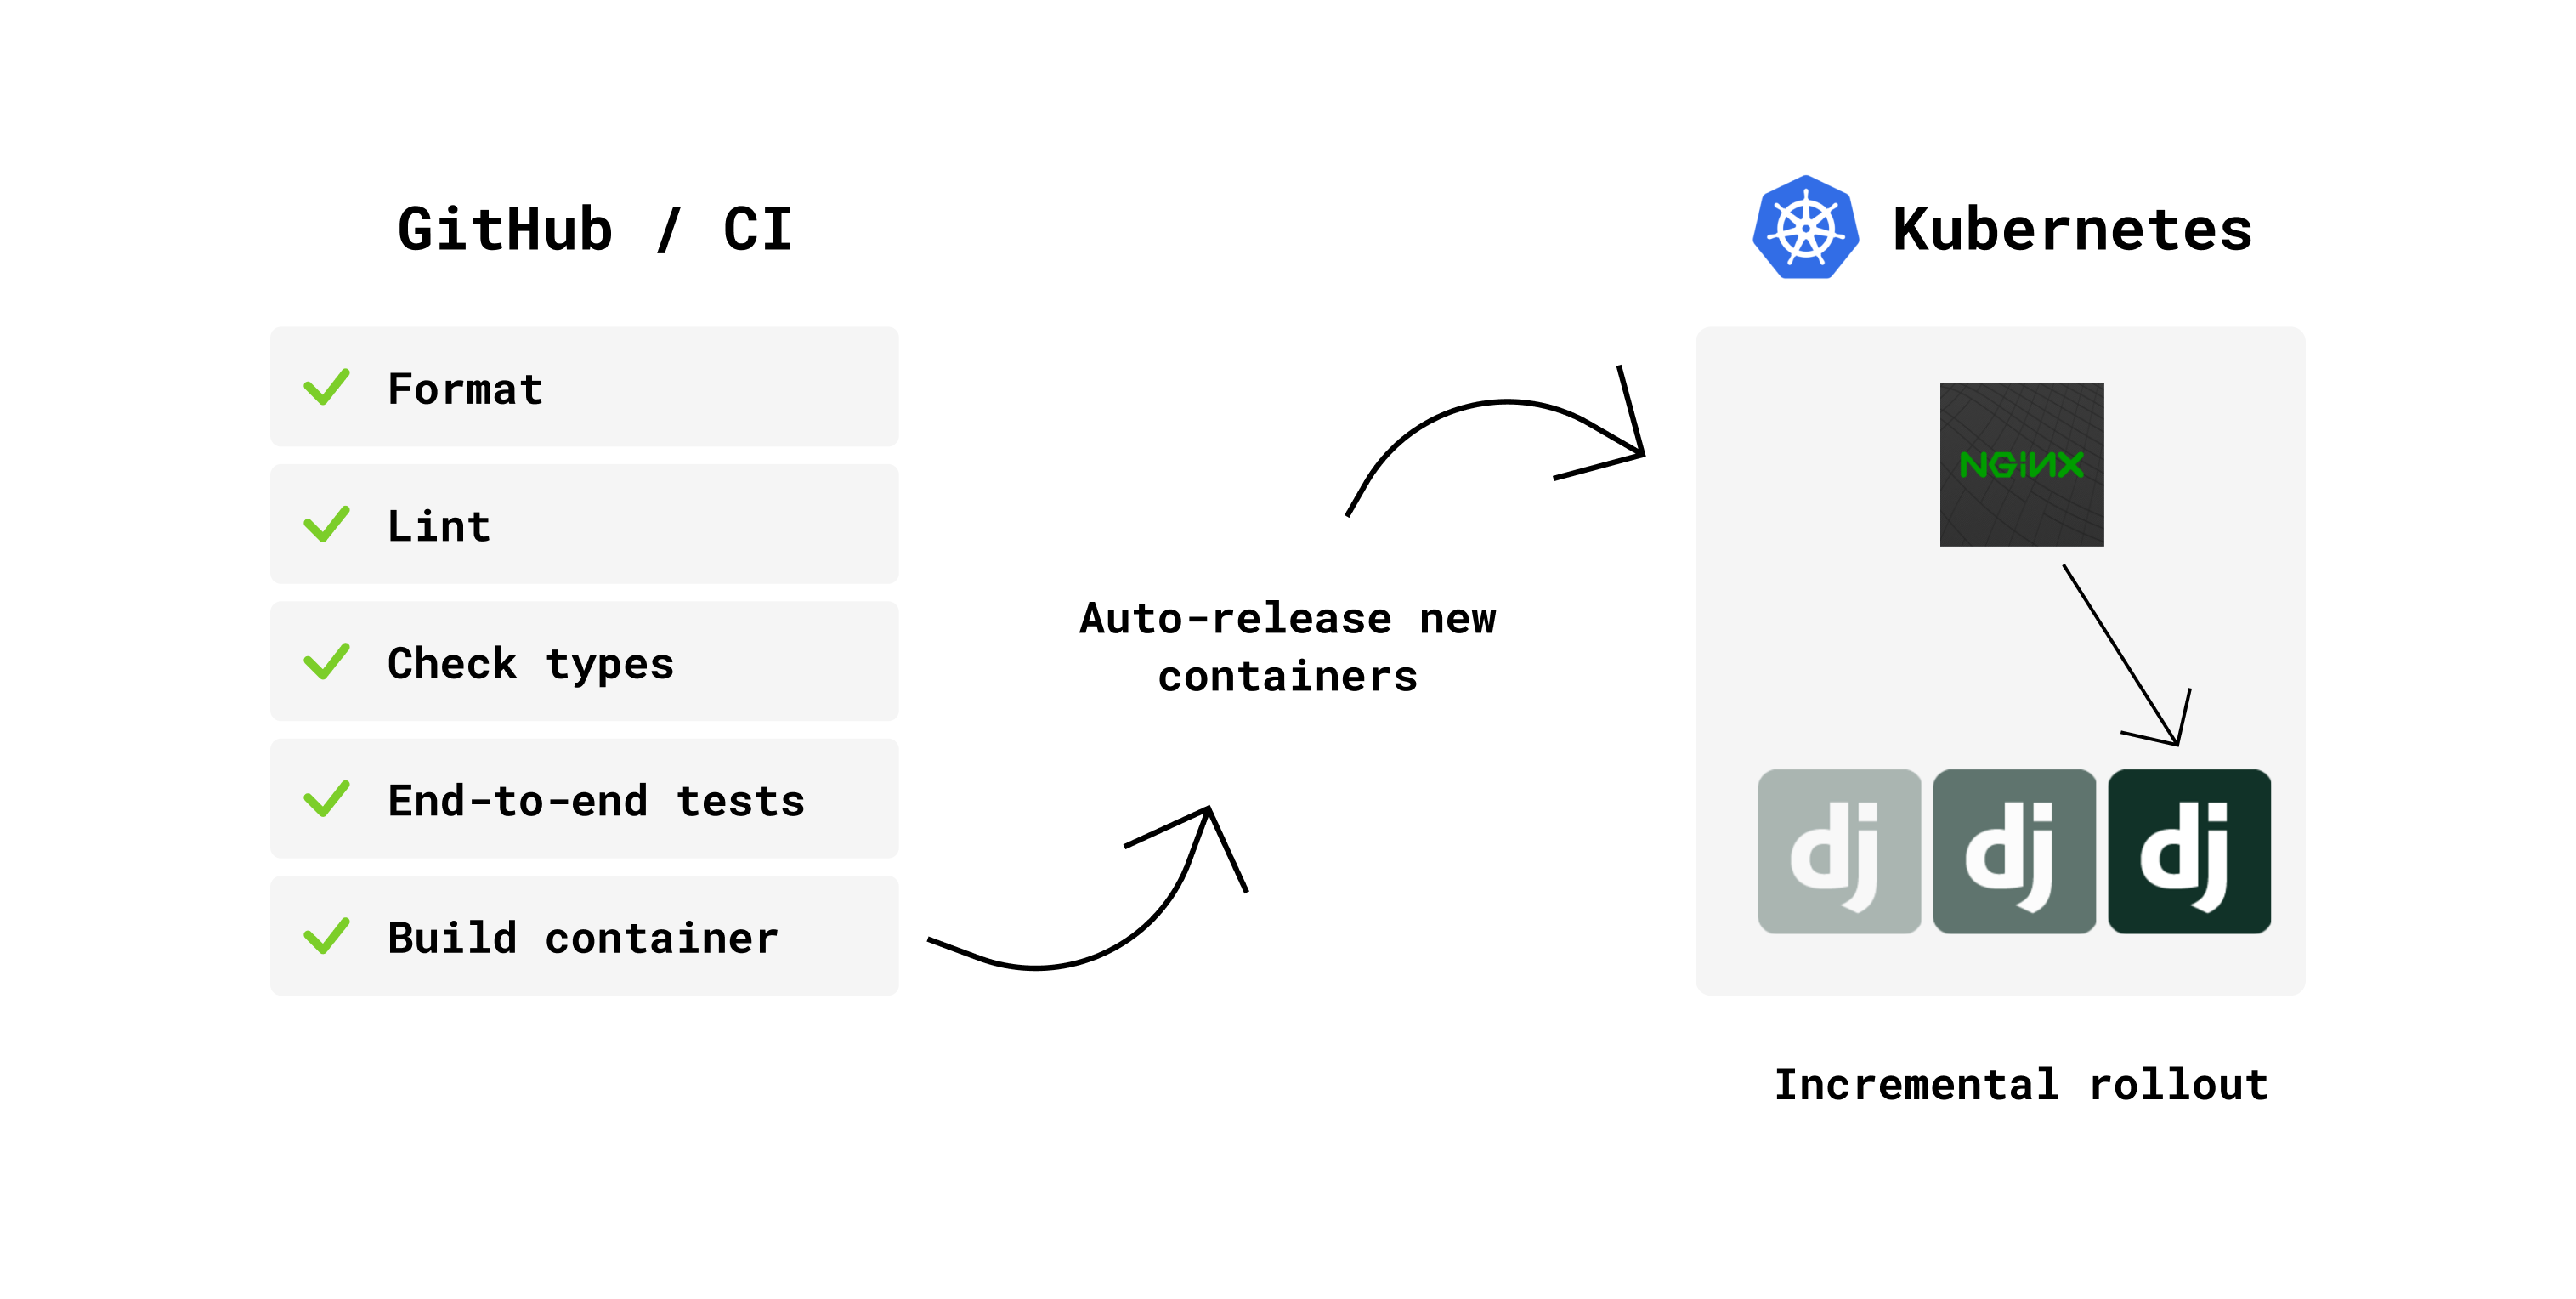 The chain of actions that occur when I push a new commit.
Whenever I push to master one of my projects, it kicks off a CI pipeline on GitHub Actions. This pipeline runs some codebase checks, end-to-end tests (using Docker compose to setup a complete environment), and once these checks pass it builds a new Docker image that gets pushed to ECR (the Docker registry in AWS).
As far as the application repo is concerned, a new version of the app has been tested and is ready to be deployed as a Docker image:
panelbear/panelbear-webserver:6a54bb3
"So what happens next? There’s a new Docker image, but no deploy?" - My Kubernetes cluster has a component called flux. It automatically keeps in sync what is currently running in the cluster and the latest image for my apps.
 Flux automatically keeps track of new releases in my infrastructure monorepo.
Flux automatically triggers an incremental rollout when there’s a new Docker image available, and keeps record of these actions in an "Infrastructure Monorepo".
I want version controlled infrastructure, so that whenever I make a new commit on this repo, between Terraform and Kubernetes, they will make the necessary changes on AWS, Cloudflare and the other services to synchronize the state of my repo with what is deployed.
It’s all version-controlled with a linear history of every deployment made. This means less stuff for me to remember over the years, since I have no magic settings configured via clicky-clicky on some obscure UI.
Think of this monorepo as deployable documentation, but more on that later.
Let it crash
A few years ago I used the Actor model of concurrency for various company projects, and fell in love with many of the ideas around its ecosystem. One thing led to another and soon I was reading books about Erlang, and its philosophy around letting things crash.
I might be stretching the idea too much, but in Kubernetes I like to think of liveliness probes and automatic restarts as a means to achieve a similar effect.
From the Kubernetes documentation: “The kubelet uses liveness probes to know when to restart a container. For example, liveness probes could catch a deadlock, where an application is running, but unable to make progress. Restarting a container in such a state can help to make the application more available despite bugs.”
In practice this has worked pretty well for me. Containers and nodes are meant to come and go, and Kubernetes will gracefully shift the traffic to healthy pods while healing the unhealthy ones (more like killing). Brutal, but effective.
Horizontal autoscaling
My app containers auto-scale based on CPU/Memory usage. Kubernetes will try to pack as many workloads per node as possible to fully utilize it.
In case there’s too many Pods per node in the cluster, it will automatically spawn more servers to increase the cluster capacity and ease the load. Similarly, it will scale down when there’s not much going on.
Here’s what a Horizontal Pod Autoscaler might look like:
apiVersion: autoscaling/v1
kind: HorizontalPodAutoscaler
metadata:
 name: panelbear-api
 namespace: panelbear
spec:
 scaleTargetRef:
   apiVersion: apps/v1
   kind: Deployment
   name: panelbear-api
 minReplicas: 2
 maxReplicas: 8
 targetCPUUtilizationPercentage: 50
In this example, it will automatically adjust the number of panelbear-api pods based on the CPU usage, starting at 2 replicas but capping at 8.
Static assets cached by CDN
When defining the ingress rules for my app, the annotation cloudflare-proxied: "true" is what tells the Kubernetes that I want to use Cloudflare for DNS, and to proxy all requests via it’s CDN and DDoS protection too.
From then on, it’s pretty easy to make use of it. I just set standard HTTP cache headers in my applications to specify which requests can be cached, and for how long.
# Cache this response for 5 minutes
response["Cache-Control"] = "public, max-age=300"
Cloudflare will use those response headers to control the caching behavior at the edge servers. It works amazingly well for such a simple setup.
I use Whitenoise to serve static files directly from my app container. That way I avoid needing to upload static files to Nginx/Cloudfront/S3 on each deployment. It has worked really well so far, and most requests will get cached by the CDN as it gets filled. It's performant, and keeps things simple.
I also use NextJS for a few static websites, such as the landing page of Panelbear. I could serve it via Cloudfront/S3 or even Netlify or Vercel, but it was easy to just run it as a container in my cluster and let Cloudflare cache the static assets as they are being requested. There’s zero added cost for me to do this, and I can re-use all tooling for deployment, logging and monitoring.
Application data caching
Besides static file caching, there's also application data caching (eg. results of heavy calculations, Django models, rate-limiting counters, etc...).
On one hand I leverage an in-memory Least Recently Used (LRU) cache to keep frequently accessed objects in memory, and I’d benefit from zero network calls (pure Python, no Redis involved).
However, most endpoints just use the in-cluster Redis for caching. It's still fast and the cached data can be shared by all Django instances, even after re-deploys, while an in-memory cache would get wiped.
Here's a real-world example:
My Pricing Plans are based on analytics events per month. For this some sort of metering is necessary to know how many events have been consumed within the current billing period and enforce limits. However, I don't interrupt the service immediately when a customer crosses the limit. Instead a "Capacity depleted" email is automatically sent, and a grace period is given to the customer before the API starts rejecting new data.
This is meant to give customers enough time to decide if an upgrade makes sense for them, while ensuring no data is lost. For example during a traffic spike in case their content goes viral or if they're just enjoying the weekend and not checking their emails. If the customer decides to stay in the current plan and not upgrade, there is no penalty and things will go back to normal once usage is back within their plan limits.
So for this feature I have a function that applies the rules above, which require several calls to the DB and ClickHouse, but get cached 15 minutes to avoid recomputing this on every request. It's good enough and simple. Worth noting: the cache gets invalidated on plan changes, otherwise it might take 15 minutes for an upgrade to take effect.
@cache(ttl=60 * 15)
def has_enough_capacity(site: Site) -> bool:
 """
 Returns True if a Site has enough capacity to accept incoming events,
 or False if it already went over the plan limits, and the grace period is over.
 """
Per endpoint rate-limiting
While I enforce global rate limits at the nginx-ingress on Kubernetes, I sometimes want more specific limits on a per endpoint/method basis.
For that I use the excellent Django Ratelimit library to easily declare the limits per Django view. It's configured to use Redis as a backend for keeping track of the clients making the requests to each endpoint (it stores a hash based on the client key, and not the IP).
For example:
class MySensitiveActionView(RatelimitMixin, LoginRequiredMixin):
 ratelimit_key = "user_or_ip"
 ratelimit_rate = "5/m"
 ratelimit_method = "POST"
 ratelimit_block = True

 def get():
   ...

 def post():
   ...
In the example above, if the client attempts to POST to this particular endpoint more than 5 times per minute, the subsequent call will get rejected with a HTTP 429 Too Many Requests status code.
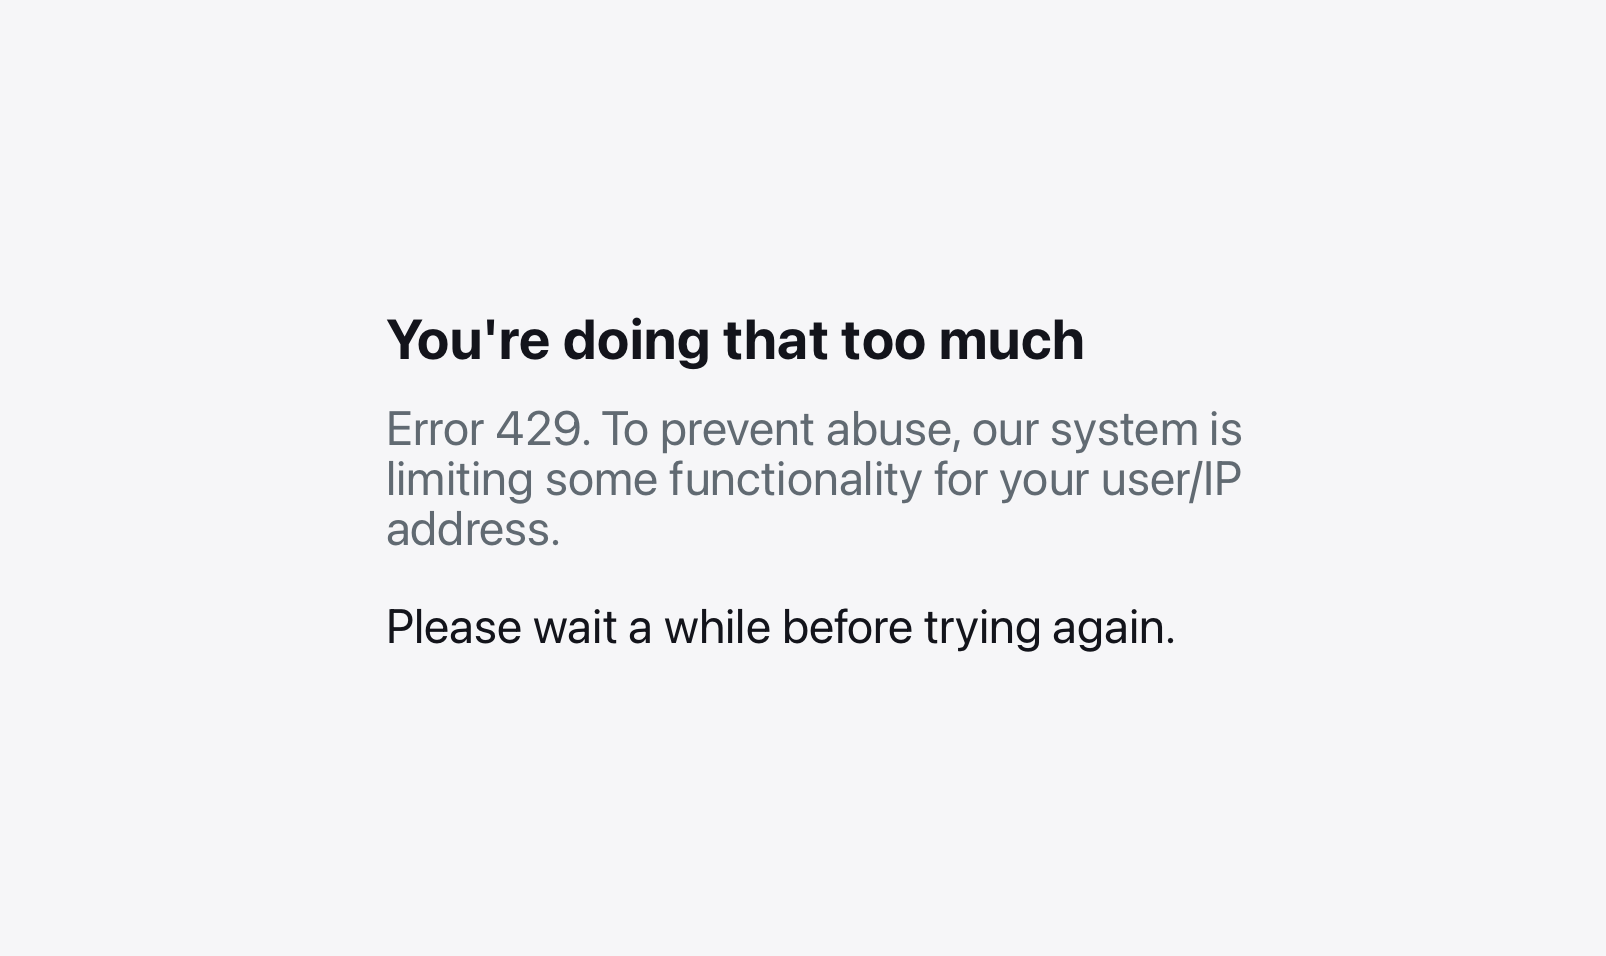 The friendly error message you'd get when being rate-limited.
App administration
Django gives me an admin panel for all my models for free. It’s built-in, and It’s pretty handy for inspecting data for customer support work on the go.
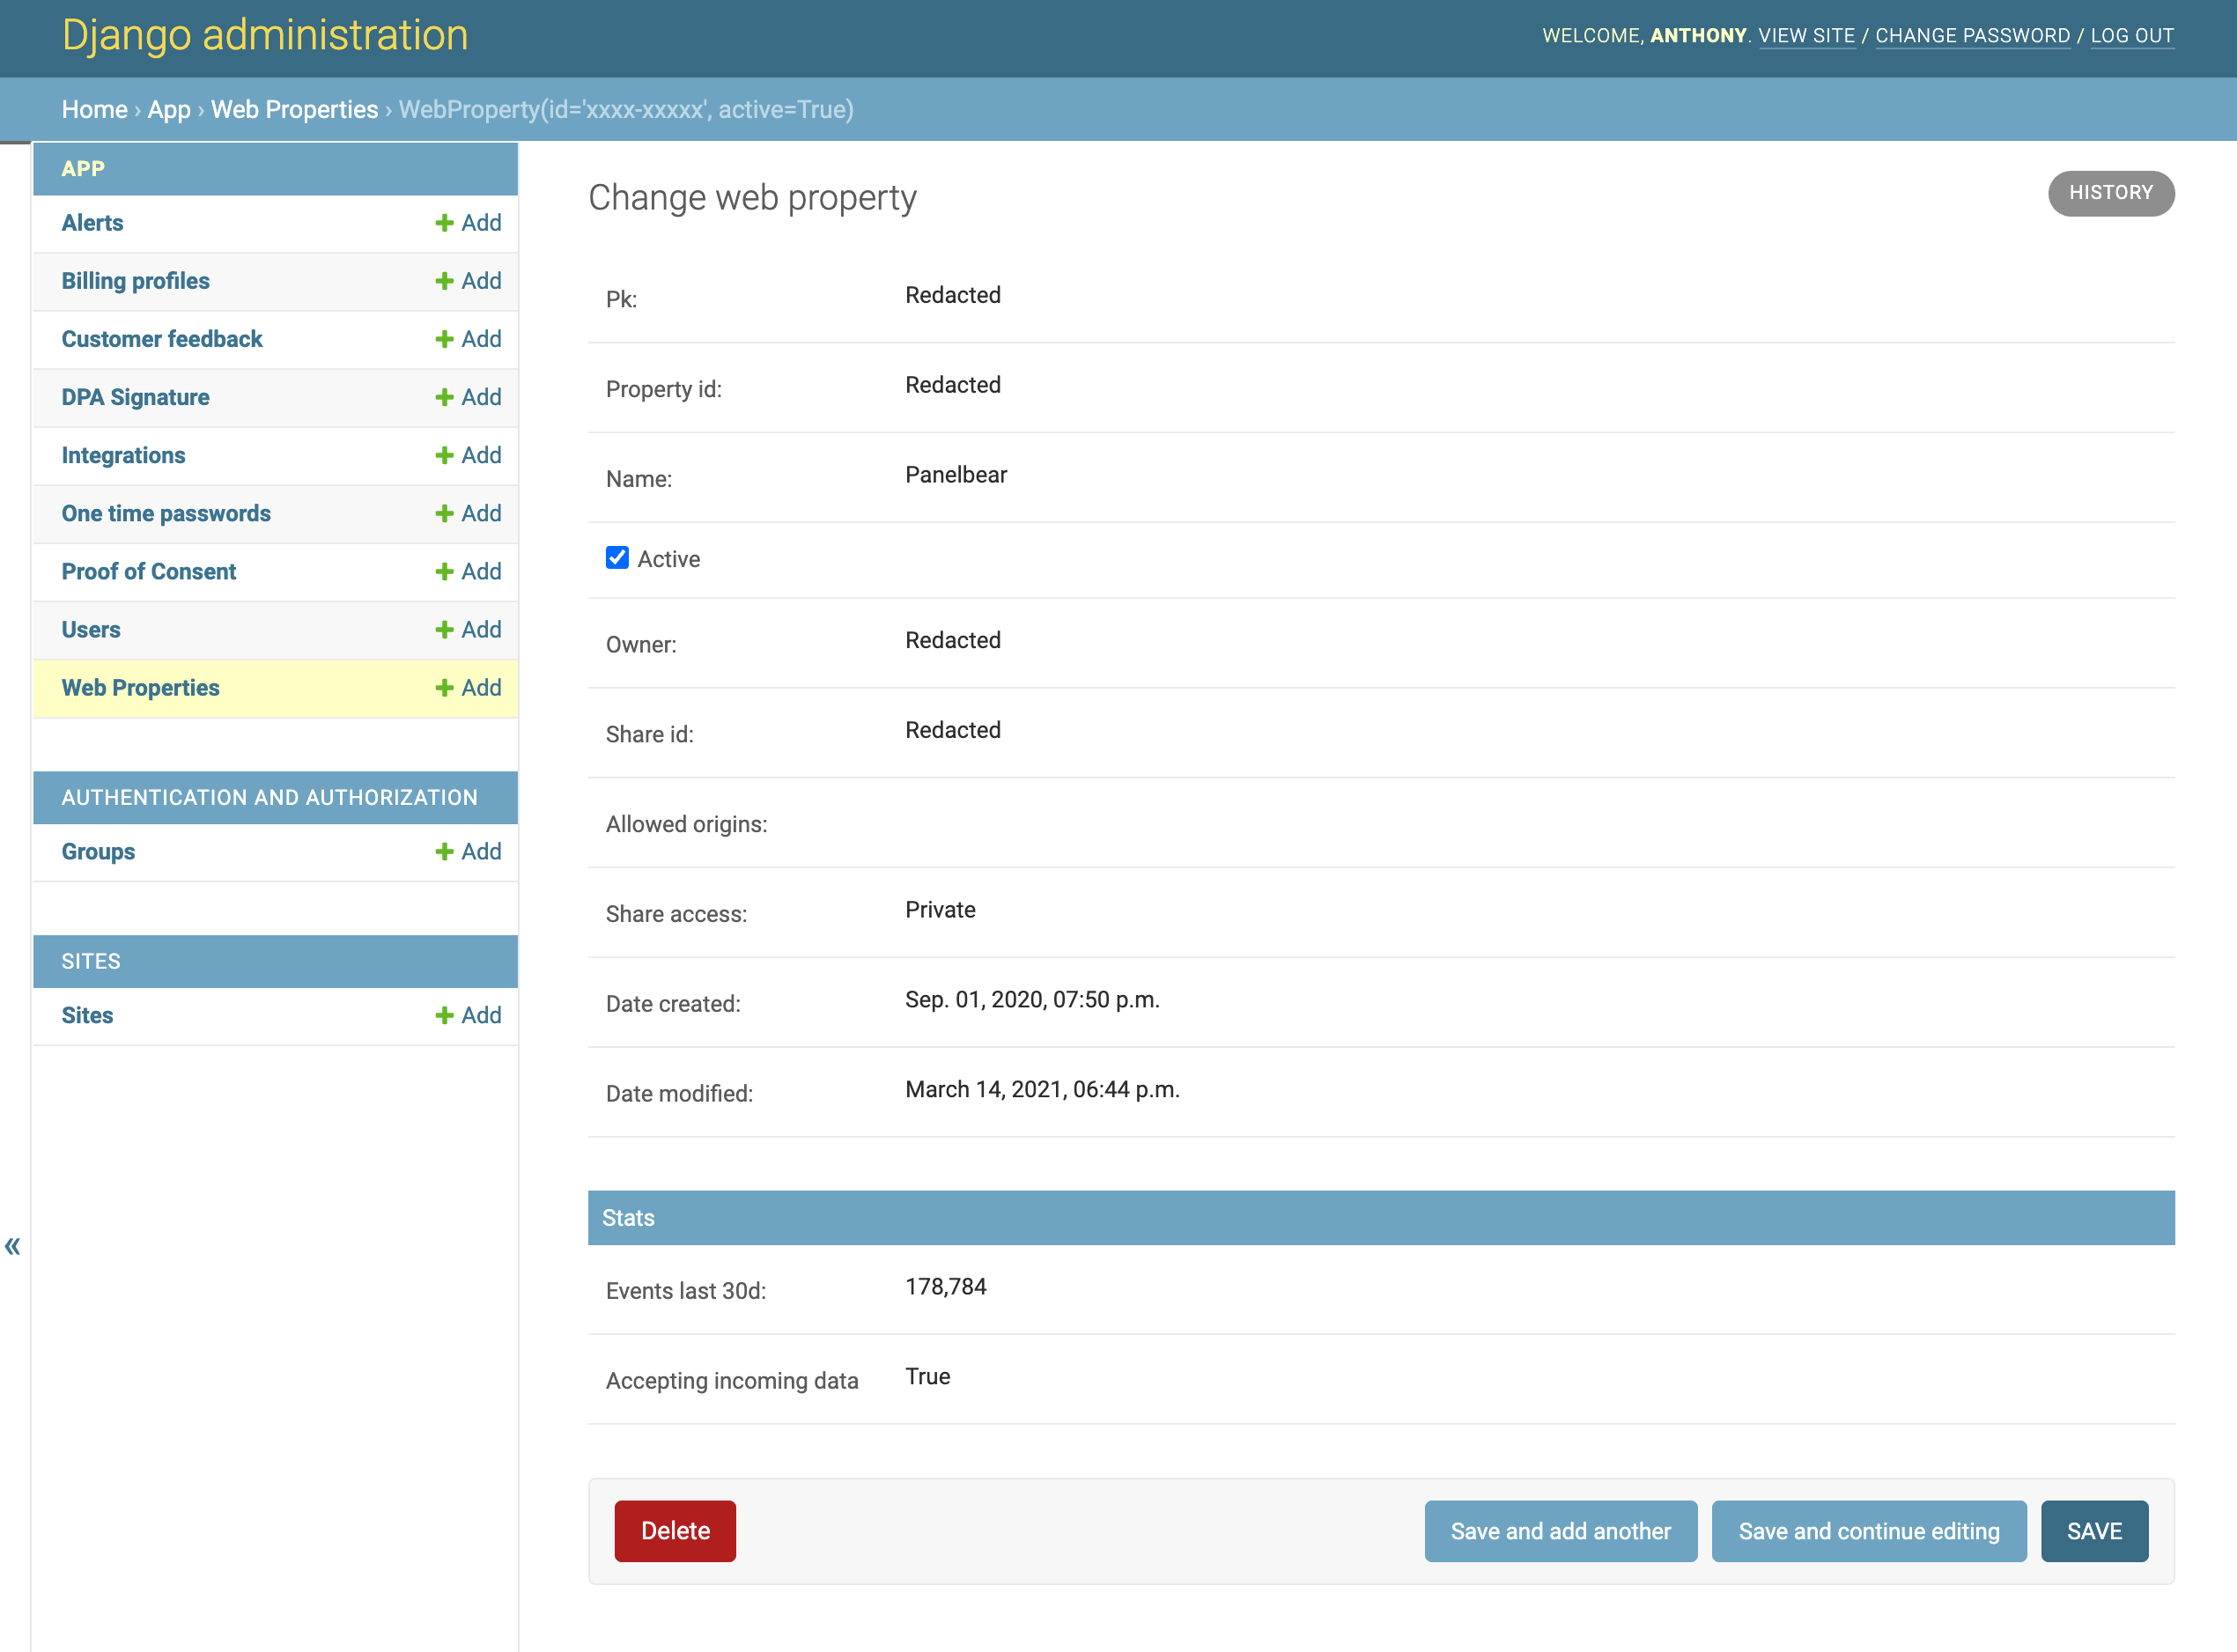 Django's built-in admin panel is very useful for doing customer support on the go.
I added actions to help me manage things from the UI. Things like blocking access to suspicious accounts, sending out announcement emails, and approving full account deletion requests (first a soft delete, and within 72 hours a full destroy).
Security-wise: only staff users are able to access the panel (me), and I’m planning to add 2FA for extra security on all accounts.
Additionally every time a user logs in, I send an automatic security email with details about the new session to the account’s email. Right now I send it on every new login, but I might change it in the future to skip known devices. It’s not a very “MVP feature”, but I care about security and it was not complicated to add. At least I’d be warned if someone logged in to my account.
Of course, there's a lot more to hardening an application than this, but that's out of the scope of this post.
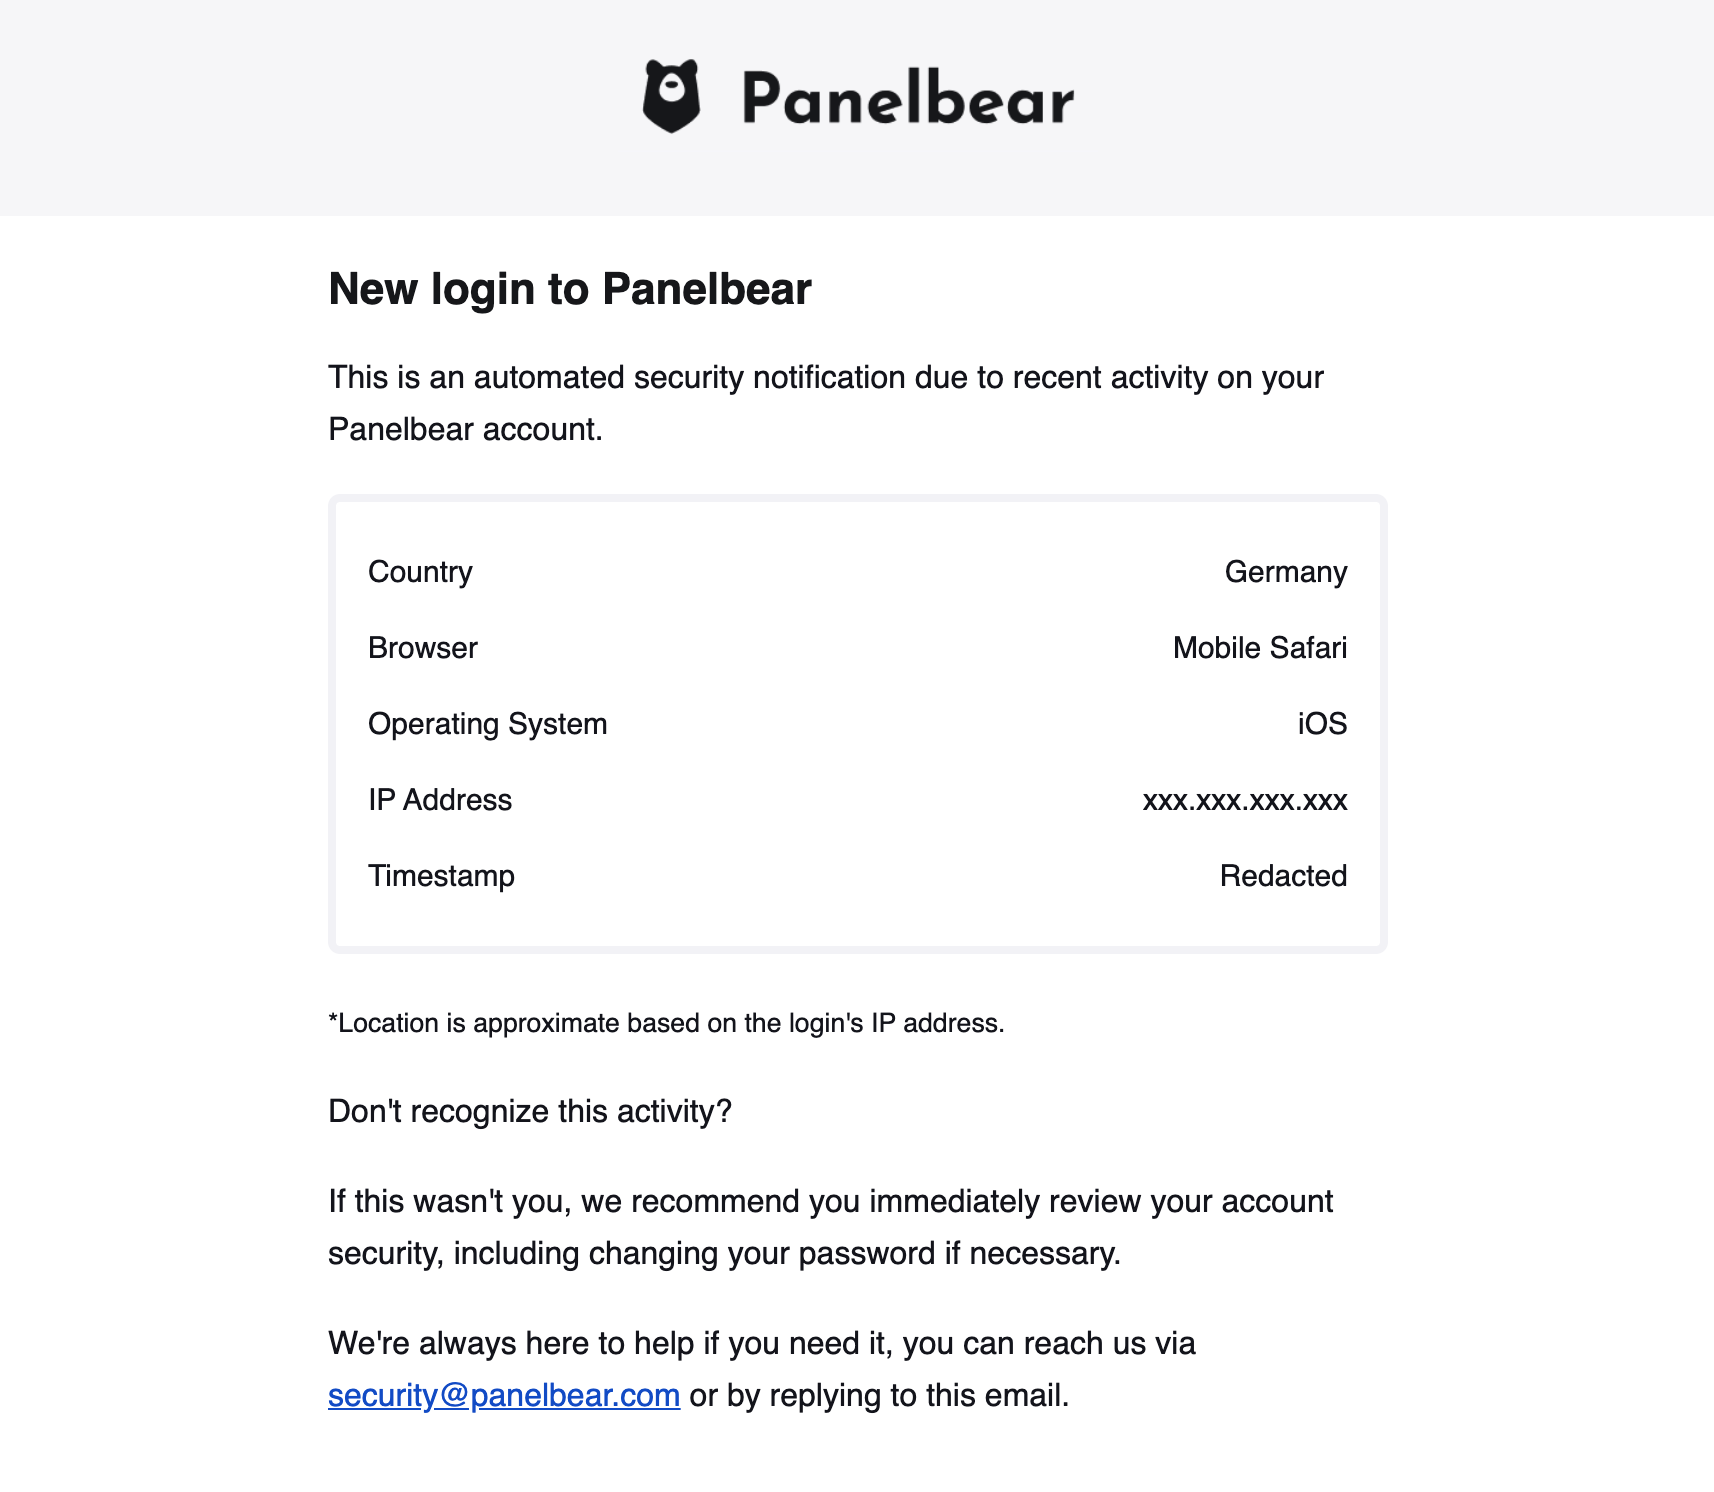 Example security activity email you might receive when logging in.
Running scheduled jobs
Another interesting use case is that I run a lot of different scheduled jobs as part of my SaaS. These are things like generating daily reports for my customers, calculating usage stats every 15 minutes, sending staff emails (I get a daily email with the most important metrics) and whatnot.
My setup is actually pretty simple, I just have a few Celery workers and a Celery beat scheduler running in the cluster. They are configured to use Redis as the task queue. It took me an afternoon to set it up once, and luckily I haven’t had any issues so far.
I want to get notified via SMS/Slack/Email when a scheduled task is not running as expected. For example when the weekly reports task is stuck or significantly delayed. For that I use Cronitor.io.
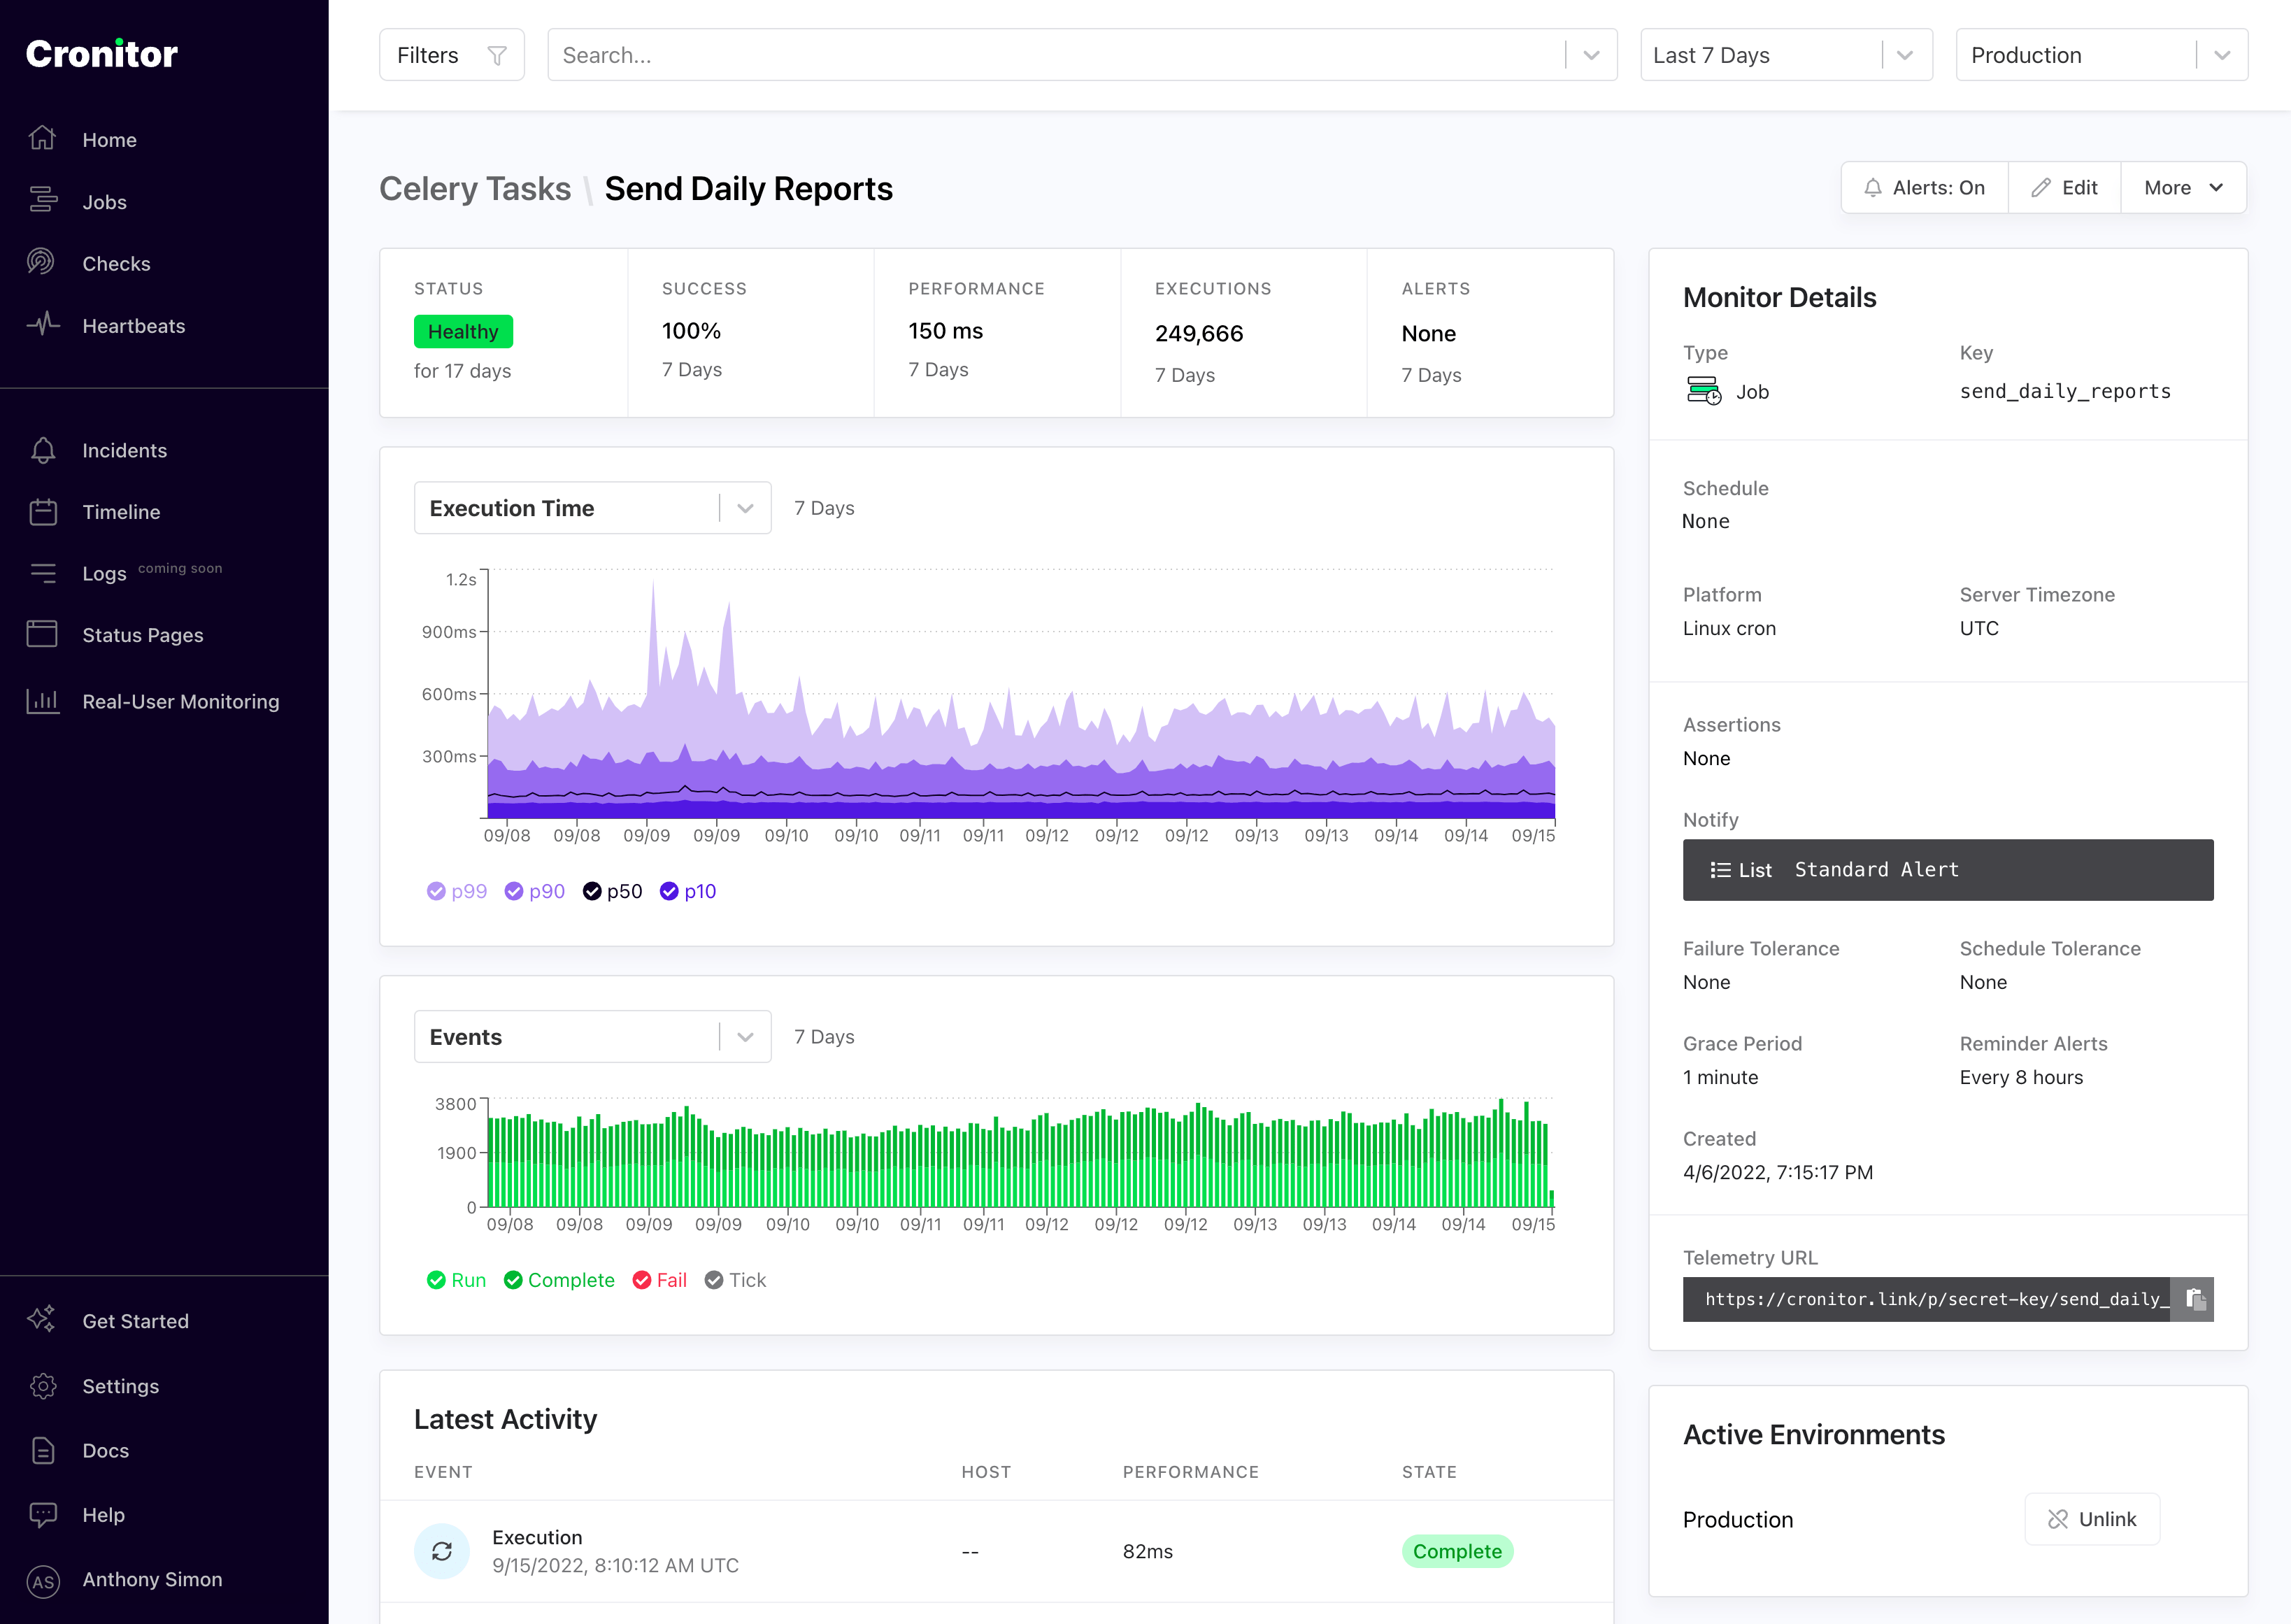 The cron job monitoring dashboard from Cronitor.io
The celery monitoring integration makes it super easy to instrument my scheduled tasks:
# Auto-discovers celery beat tasks

import cronitor.celery
from celery import Celery

app = Celery()
cronitor.celery.initialize(app, api_key="super-secret", celerybeat_only=True)
App configuration
All my applications are configured via environment variables, old school but portable and well supported. For example, in my Django settings.py I’d setup a variable with a default value:
INVITE_ONLY = env.str("INVITE_ONLY", default=False)
And use it anywhere in my code like this:
from django.conf import settings

# If invite-only, then disable account creation endpoints
if settings.INVITE_ONLY:
 ...
I can override the environment variable in my Kubernetes configmap:
apiVersion: v1
kind: ConfigMap
metadata:
 namespace: panelbear
 name: panelbear-webserver-config
data:
 INVITE_ONLY: "True"
 DEFAULT_FROM_EMAIL: "The Panelbear Team <[email protected]>"
 SESSION_COOKIE_SECURE: "True"
 SECURE_HSTS_PRELOAD: "True"
 SECURE_SSL_REDIRECT: "True"
Keeping secrets
The way secrets are handled is pretty interesting: I want to also commit them to my infrastructure repo, alongside other config files, but secrets should be encrypted.
For that I use kubeseal in Kubernetes. This component uses asymmetric crypto to encrypt my secrets, and only a cluster authorized to access the decryption keys can decrypt them.
For example this is what you might find in my infrastructure repo:
apiVersion: bitnami.com/v1alpha1
kind: SealedSecret
metadata:
 name: panelbear-secrets
 namespace: panelbear
spec:
 encryptedData:
   DATABASE_CONN_URL: AgBy3i4OJSWK+PiTySYZZA9rO43cGDEq...
   SESSION_COOKIE_SECRET: oi7ySY1ZA9rO43cGDEq+ygByri4OJBlK...
   ...
The cluster will automatically decrypt the secrets and pass them to the corresponding container as an environment variable:
DATABASE_CONN_URL='postgres://user:pass@my-rds-db:5432/db'
SESSION_COOKIE_SECRET='this-is-supposed-to-be-very-secret'
To protect the secrets within the cluster, I use AWS-managed encryption keys via KMS, which are rotated regularly. This is a single setting when creating the Kubernetes cluster, and it's fully managed.
Operationally what this means is that I write the secrets as environment variables in a Kubernetes manifest, I then run a command to encrypt them before committing, and push my changes.
The secrets are deployed within a few seconds, and the cluster will take care of automatically decrypting them before running my containers.
Relational data: Postgres
For experiments I run a vanilla Postgres container within the cluster, and a Kubernetes cronjob that does daily backups to S3. This helps keep my costs down, and it’s pretty simple for just starting out.
However, as a project grows, like Panelbear, I move the database out of the cluster into RDS, and let AWS take care of encrypted backups, security updates and all the other stuff that’s no fun to mess up.
For added security, the databases managed by AWS are still deployed within my private network, so they’re unreachable via the public internet.
Columnar data: ClickHouse
I rely on ClickHouse for efficient storage and (soft) real-time queries over the analytics data in Panelbear. It’s a fantastic columnar database, incredibly fast and when you structure your data well you can achieve high compression ratios (less storage costs = higher margins).
I currently self-host a ClickHouse instance within my Kubernetes cluster. I use a StatefulSet with encrypted volume keys managed by AWS. I have a Kubernetes CronJob that periodically backups up all data in an efficient columnar format to S3. In case of disaster recovery, I have a couple of scripts to manually backup and restore the data from S3.
ClickHouse has been rock-solid so far, and it’s an impressive piece of software. It’s the only tool I wasn’t already familiar with when I started my SaaS, but thanks to their docs I was able to get up and running pretty quickly.
I think there’s a lot of low hanging fruit in case I wanted to squeeze out even more performance (eg. optimizing the field types for better compression, pre-computing materialized tables and tuning the instance type), but it’s good enough for now.
DNS-based service discovery
Besides Django, I also run containers for Redis, ClickHouse, NextJS, among other things. These containers have to talk to each other somehow, and that somehow is via the built-in service discovery in Kubernetes.
It’s pretty simple: I define a Service resource for the container and Kubernetes automatically manages DNS records within the cluster to route traffic to the corresponding service.
For example, given a Redis service exposed within the cluster:
apiVersion: v1
kind: Service
metadata:
 name: redis
 namespace: weekend-project
labels:
 app: redis
spec:
 type: ClusterIP
 ports:
   - port: 6379
 selector:
   app: redis
I can access this Redis instance anywhere from my cluster via the following URL:
redis://redis.weekend-project.svc.cluster:6379
Notice the service name and the project namespace is part of the URL. That makes it really easy for all your cluster services to talk to each other, regardless of where in the cluster they run.
For example, here’s how I’d configure Django via environment variables to use my in-cluster Redis:
apiVersion: v1
kind: ConfigMap
metadata:
 name: panelbear-config
 namespace: panelbear
data:
 CACHE_URL: "redis://redis.panelbear.svc.cluster:6379/0"
 ENV: "production"
 ...
Kubernetes will automatically keep the DNS records in-sync with healthy pods, even as containers get moved across nodes during autoscaling. The way this works behind the scenes is pretty interesting, but out of the scope of this post. Here’s a good explanation in case you find it interesting.
Version-controlled infrastructure
I want version-controlled, reproducible infrastructure that I can create and destroy with a few simple commands.
To achieve this, I use Docker, Terraform and Kubernetes manifests in a monorepo that contains all-things infrastructure, even across multiple projects. And for each application/project I use a separate git repo, but this code is not aware of the environment it will run on.
If you’re familiar with The Twelve-Factor App this separation may ring a bell or two. Essentially, my application has no knowledge of the exact infrastructure it will run on, and is configured via environment variables.
By describing my infrastructure in a git repo, I don’t need to keep track of every little resource and configuration setting in some obscure UI. This enables me to restore my entire stack with a single command in case of disaster recovery.
Here’s an example folder structure of what you might find on the infra monorepo:
# Cloud resources
terraform/
aws/
 rds.tf
 ecr.tf
 eks.tf
 lambda.tf
 s3.tf
 roles.tf
 vpc.tf
cloudflare/
 projects.tf

# Kubernetes manifests
manifests/
 cluster/
   ingress-nginx/
   external-dns/
   certmanager/
   monitoring/

 apps/
   panelbear/
     webserver.yaml
     celery-scheduler.yaml
     celery-workers.yaml
     secrets.encrypted.yaml
     ingress.yaml
     redis.yaml
     clickhouse.yaml
   another-saas/
   my-weekend-project/
   some-ghost-blog/

# Python scripts for disaster recovery, and CI
tasks/
 ...

# In case of a fire, some help for future me
README.md
DISASTER.md
TROUBLESHOOTING.md
Another advantage of this setup is that all the moving pieces are described in one place. I can configure and manage reusable components like centralized logging, application monitoring, and encrypted secrets to name a few.
Terraform for cloud resources
I use Terraform to manage most of the underlying cloud resources. This helps me document, and keep track of the resources and configuration that makes up my infrastructure. In case of disaster recovery, I can spin up and rollback resources with a single command.
For example, here's one of my Terraform files for creating a private S3 bucket for encrypted backups which expire after 30 days:
resource "aws_s3_bucket" "panelbear_app" {
 bucket = "panelbear-app"
 acl    = "private"

 tags = {
   Name        = "panelbear-app"
   Environment = "production"
 }

 lifecycle_rule {
   id      = "backups"
   enabled = true
   prefix  = "backups/"

   expiration {
     days = 30
   }
 }

 server_side_encryption_configuration {
   rule {
     apply_server_side_encryption_by_default {
       sse_algorithm     = "AES256"
     }
   }
 }
}
Kubernetes manifests for app deployments
Similarly, all my Kubernetes manifests are described in YAML files in the infrastructure monorepo. I have split them into two directories: cluster and apps.
Inside the cluster directory I describe all cluster-wide services and configuration, things like the nginx-ingress, encrypted secrets, prometheus scrapers, and so on. Essentially the reusable bits.
On the other hand, the apps directory contains one namespace per project, describing what is needed to deploy it (ingress rules, deployments, secrets, volumes, and so on).
One of the cool things about Kubernetes, is that you can customize almost everything about your stack. So for example, if I wanted to use encrypted SSD volumes that can be resized, I could define a new “StorageClass'' in the cluster. Kubernetes and in this case AWS will coordinate and make the magic happen for me. For example:
apiVersion: storage.k8s.io/v1
kind: StorageClass
metadata:
 name: encrypted-ssd
 provisioner: kubernetes.io/aws-ebs
parameters:
 type: gp2
 encrypted: "true"
 reclaimPolicy: Retain
 allowVolumeExpansion: true
 volumeBindingMode: WaitForFirstConsumer
I can now go ahead and attach this type of persistent storage for any of my deployments, and Kubernetes will manage the requested resources for me:
# Somewhere in the ClickHouse StatefulSet configuration
...
storageClassName: encrypted-ssd
resources:
 requests:
   storage: 250Gi
...
Subscriptions and Payments
I use Stripe Checkout to save all the work in handling payments, creating checkout screens, handling 3D secure requirements from credit cards, and even the customer billing portal.
I do not have access to the payment information itself, which is a huge relief and enables me to focus on my product instead of highly sensitive topics like credit card handling and fraud prevention.
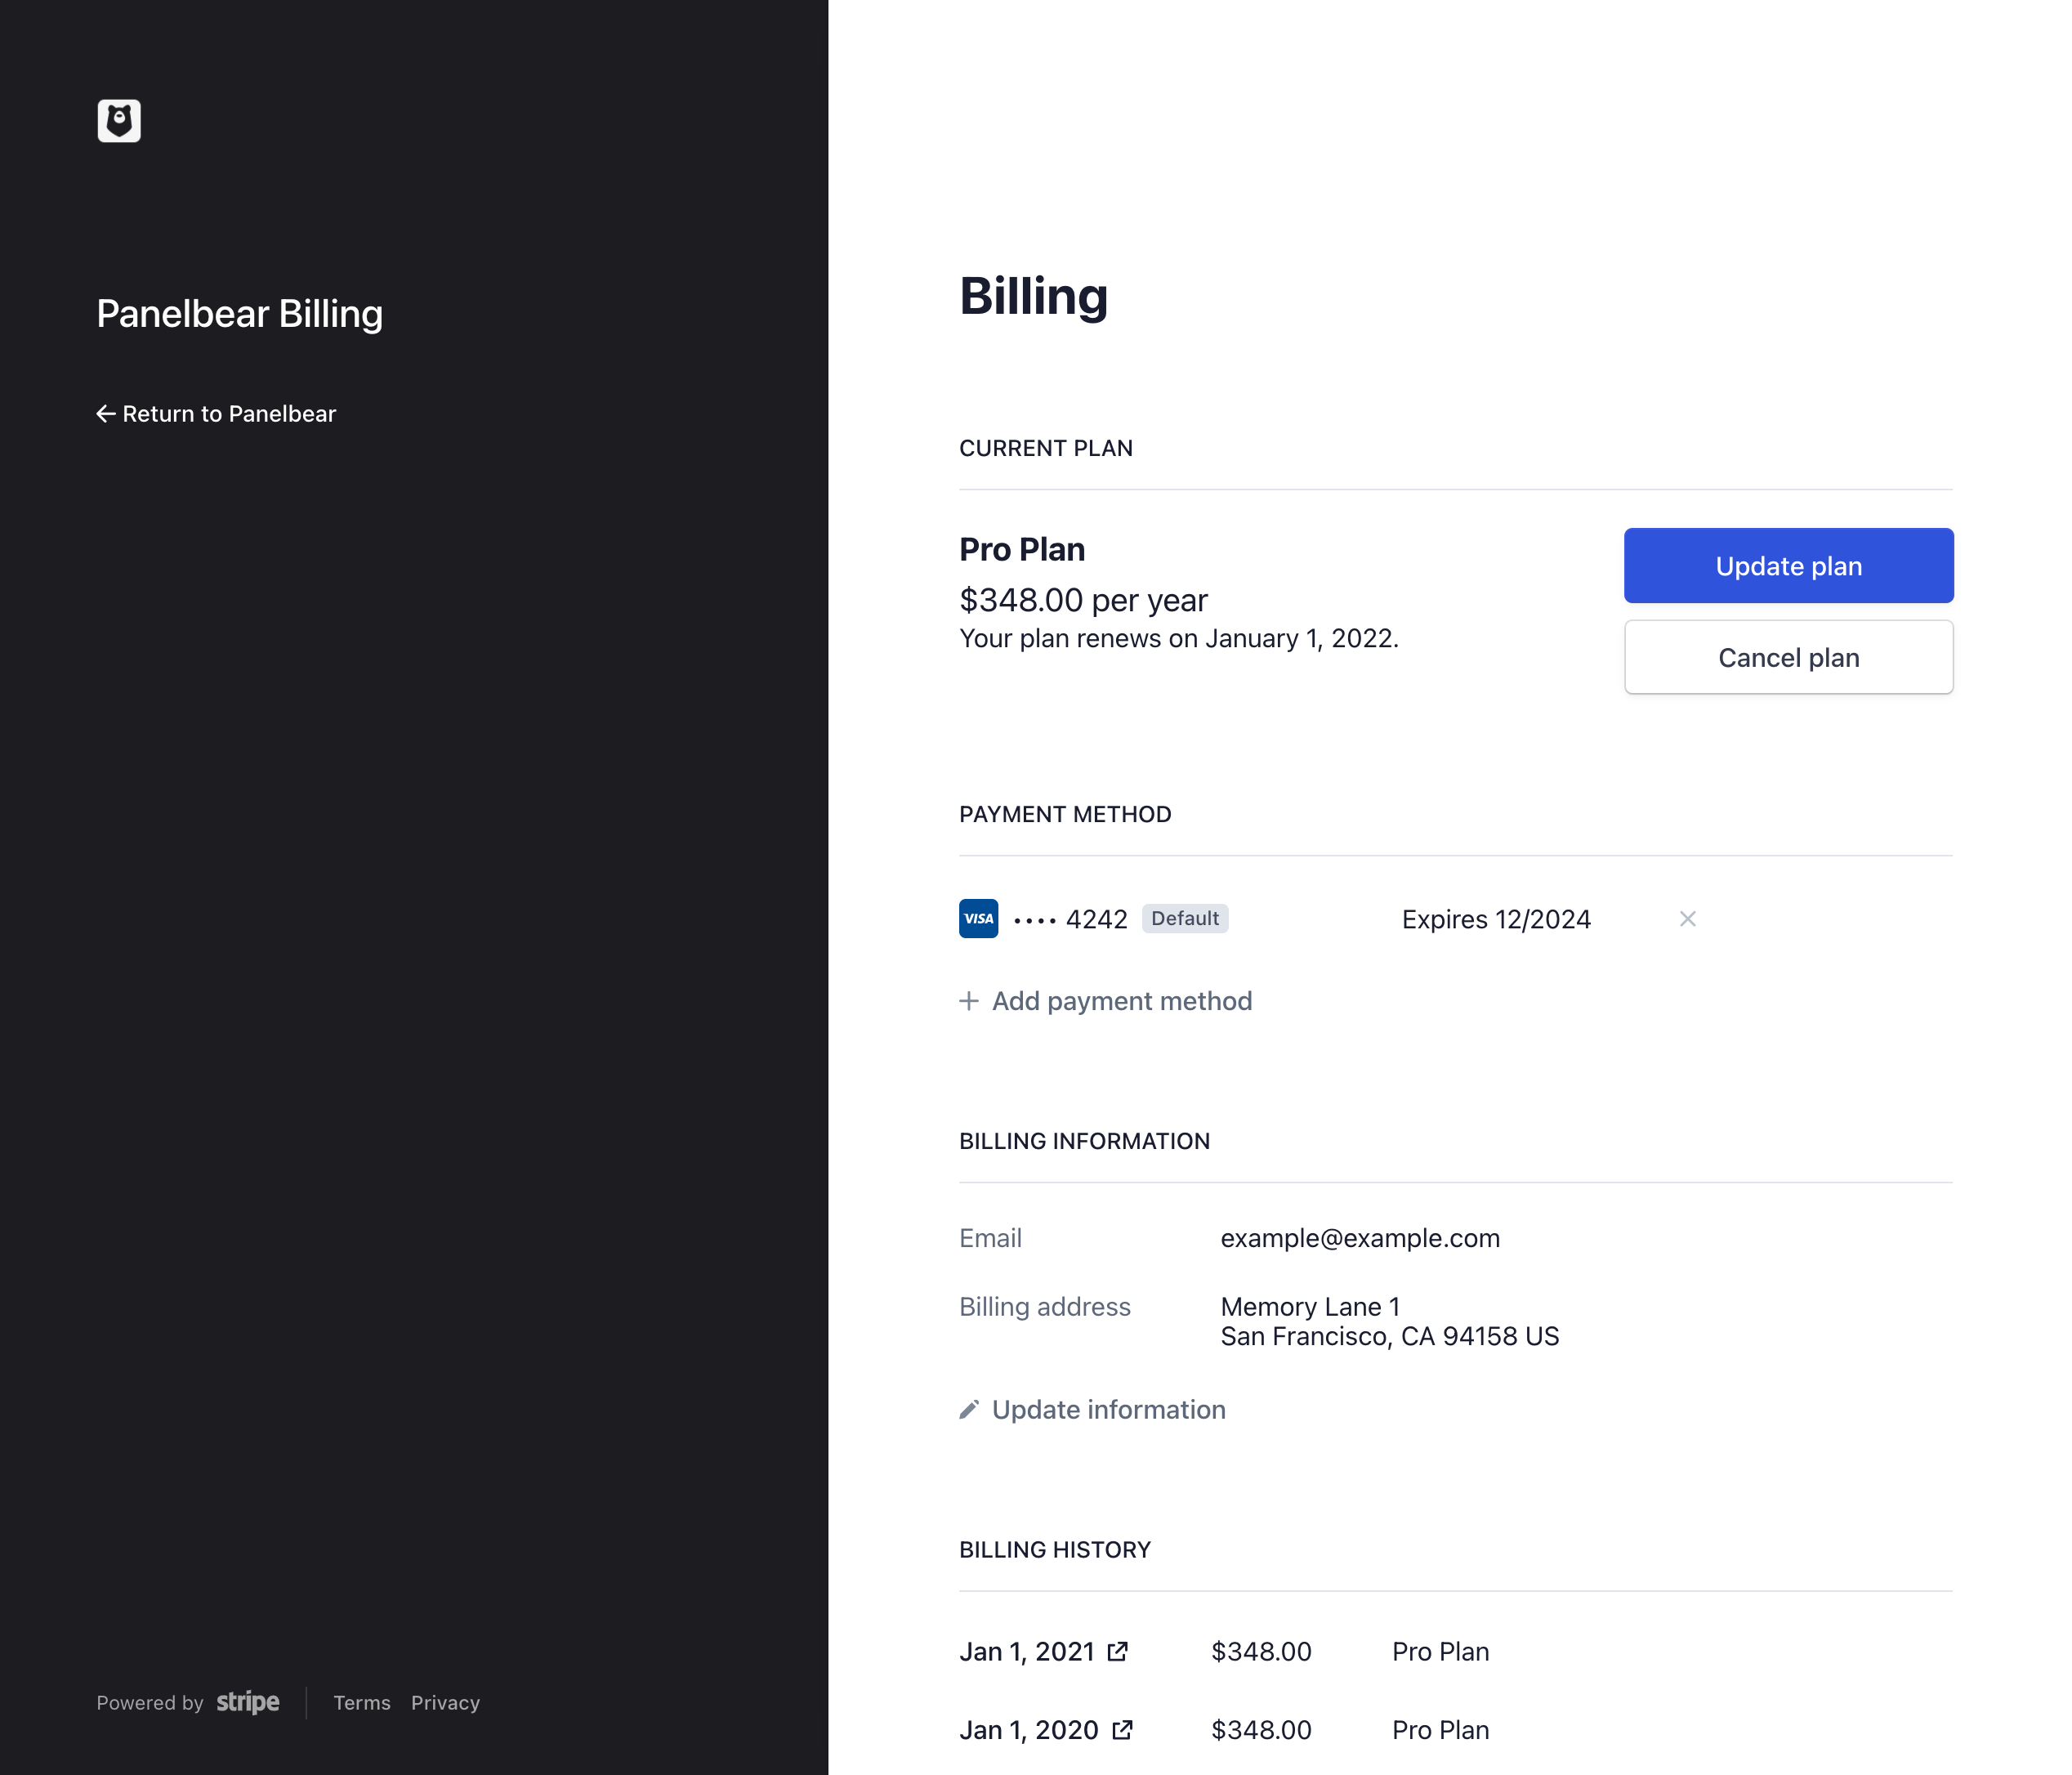 An example Customer Billing Portal in Panelbear.
All I have to do is create a new customer session and redirect the customer to one of Stripe's hosted pages. I then listen for webhooks about whether the customer upgraded/downgraded/cancelled and update my database accordingly.
Of course there's a few important parts like validating that the webhook really came from Stripe (you have to validate the request signature with a secret), but Stripe's documentation covers all the points really well.
I only have a few plans, so it's pretty easy for me to manage them in my codebase. I essentially have something like:
# Plan constants
FREE = Plan(
  code='free',
  display_name='Free Plan',
  features={'abc', 'xyz'},
  monthly_usage_limit=5e3,
  max_alerts=1,
  stripe_price_id='...',
)

BASIC = Plan(
  code='basic',
  display_name='Basic Plan',
  features={'abc', 'xyz'},
  monthly_usage_limit=50e3,
  max_alerts=5,
  stripe_price_id='...',
)


PREMIUM = Plan(
  code='premium',
  display_name='Premium Plan',
  features={'abc', 'xyz', 'special-feature'},
  monthly_usage_limit=250e3,
  max_alerts=25,
  stripe_price_id='...',
)

# Helpers for easy access
ALL_PLANS = [FREE, BASIC, PREMIUM]
PLANS_BY_CODE = {p.code: p for p in ALL_PLANS}
I can then use it in any API endpoint, cron job and admin task to determine which limits/features apply for a given customer. The current plan for a given customer is a column called plan_code on a BillingProfile model. I separate the user from the billing information since I'm planning to add organizations/teams at some point, and that way I can easily migrate the BillingProfile to the account owner / admin user.
Of course this model won't scale if you're offering thousands of individual products in an e-commerce shop, but it works pretty well for me since a SaaS usually only has a few plans.
Logging
I don’t need to instrument my code with any logging agent or anything like that. I simply log to stdout and Kubernetes automatically collects, and rotates logs for me. I could also automatically ship those logs to something like Elasticsearch/Kibana using FluentBit, but I don’t do that yet to keep things simple.
To inspect the logs I use stern, a tiny CLI tool for Kubernetes that makes it super easy to tail application logs across multiple pods.
For example, stern -n ingress-nginx would tail the access logs for my nginx pods even across multiple nodes.
Monitoring and alerting
In the beginning I used a self-hosted Prometheus / Grafana to automatically monitor my cluster and application metrics. However, I didn’t feel comfortable self-hosting my monitoring stack, because if something went wrong in the cluster, my alerting system would go down with it too (not great).
If there’s one thing that should never go down is your monitoring system, otherwise you’re essentially flying without instruments. That’s why I swapped my monitoring / alerting system with a hosted service (New Relic).
All my services have a Prometheus integration that automatically records and forwards the metrics to a compatible backend, such as Datadog, New Relic, Grafana Cloud or a self-hosted Prometheus instance (what I used to do). To migrate to New Relic, all I had to do was to use their Prometheus Docker image, and shutdown the self-hosted monitoring stack.
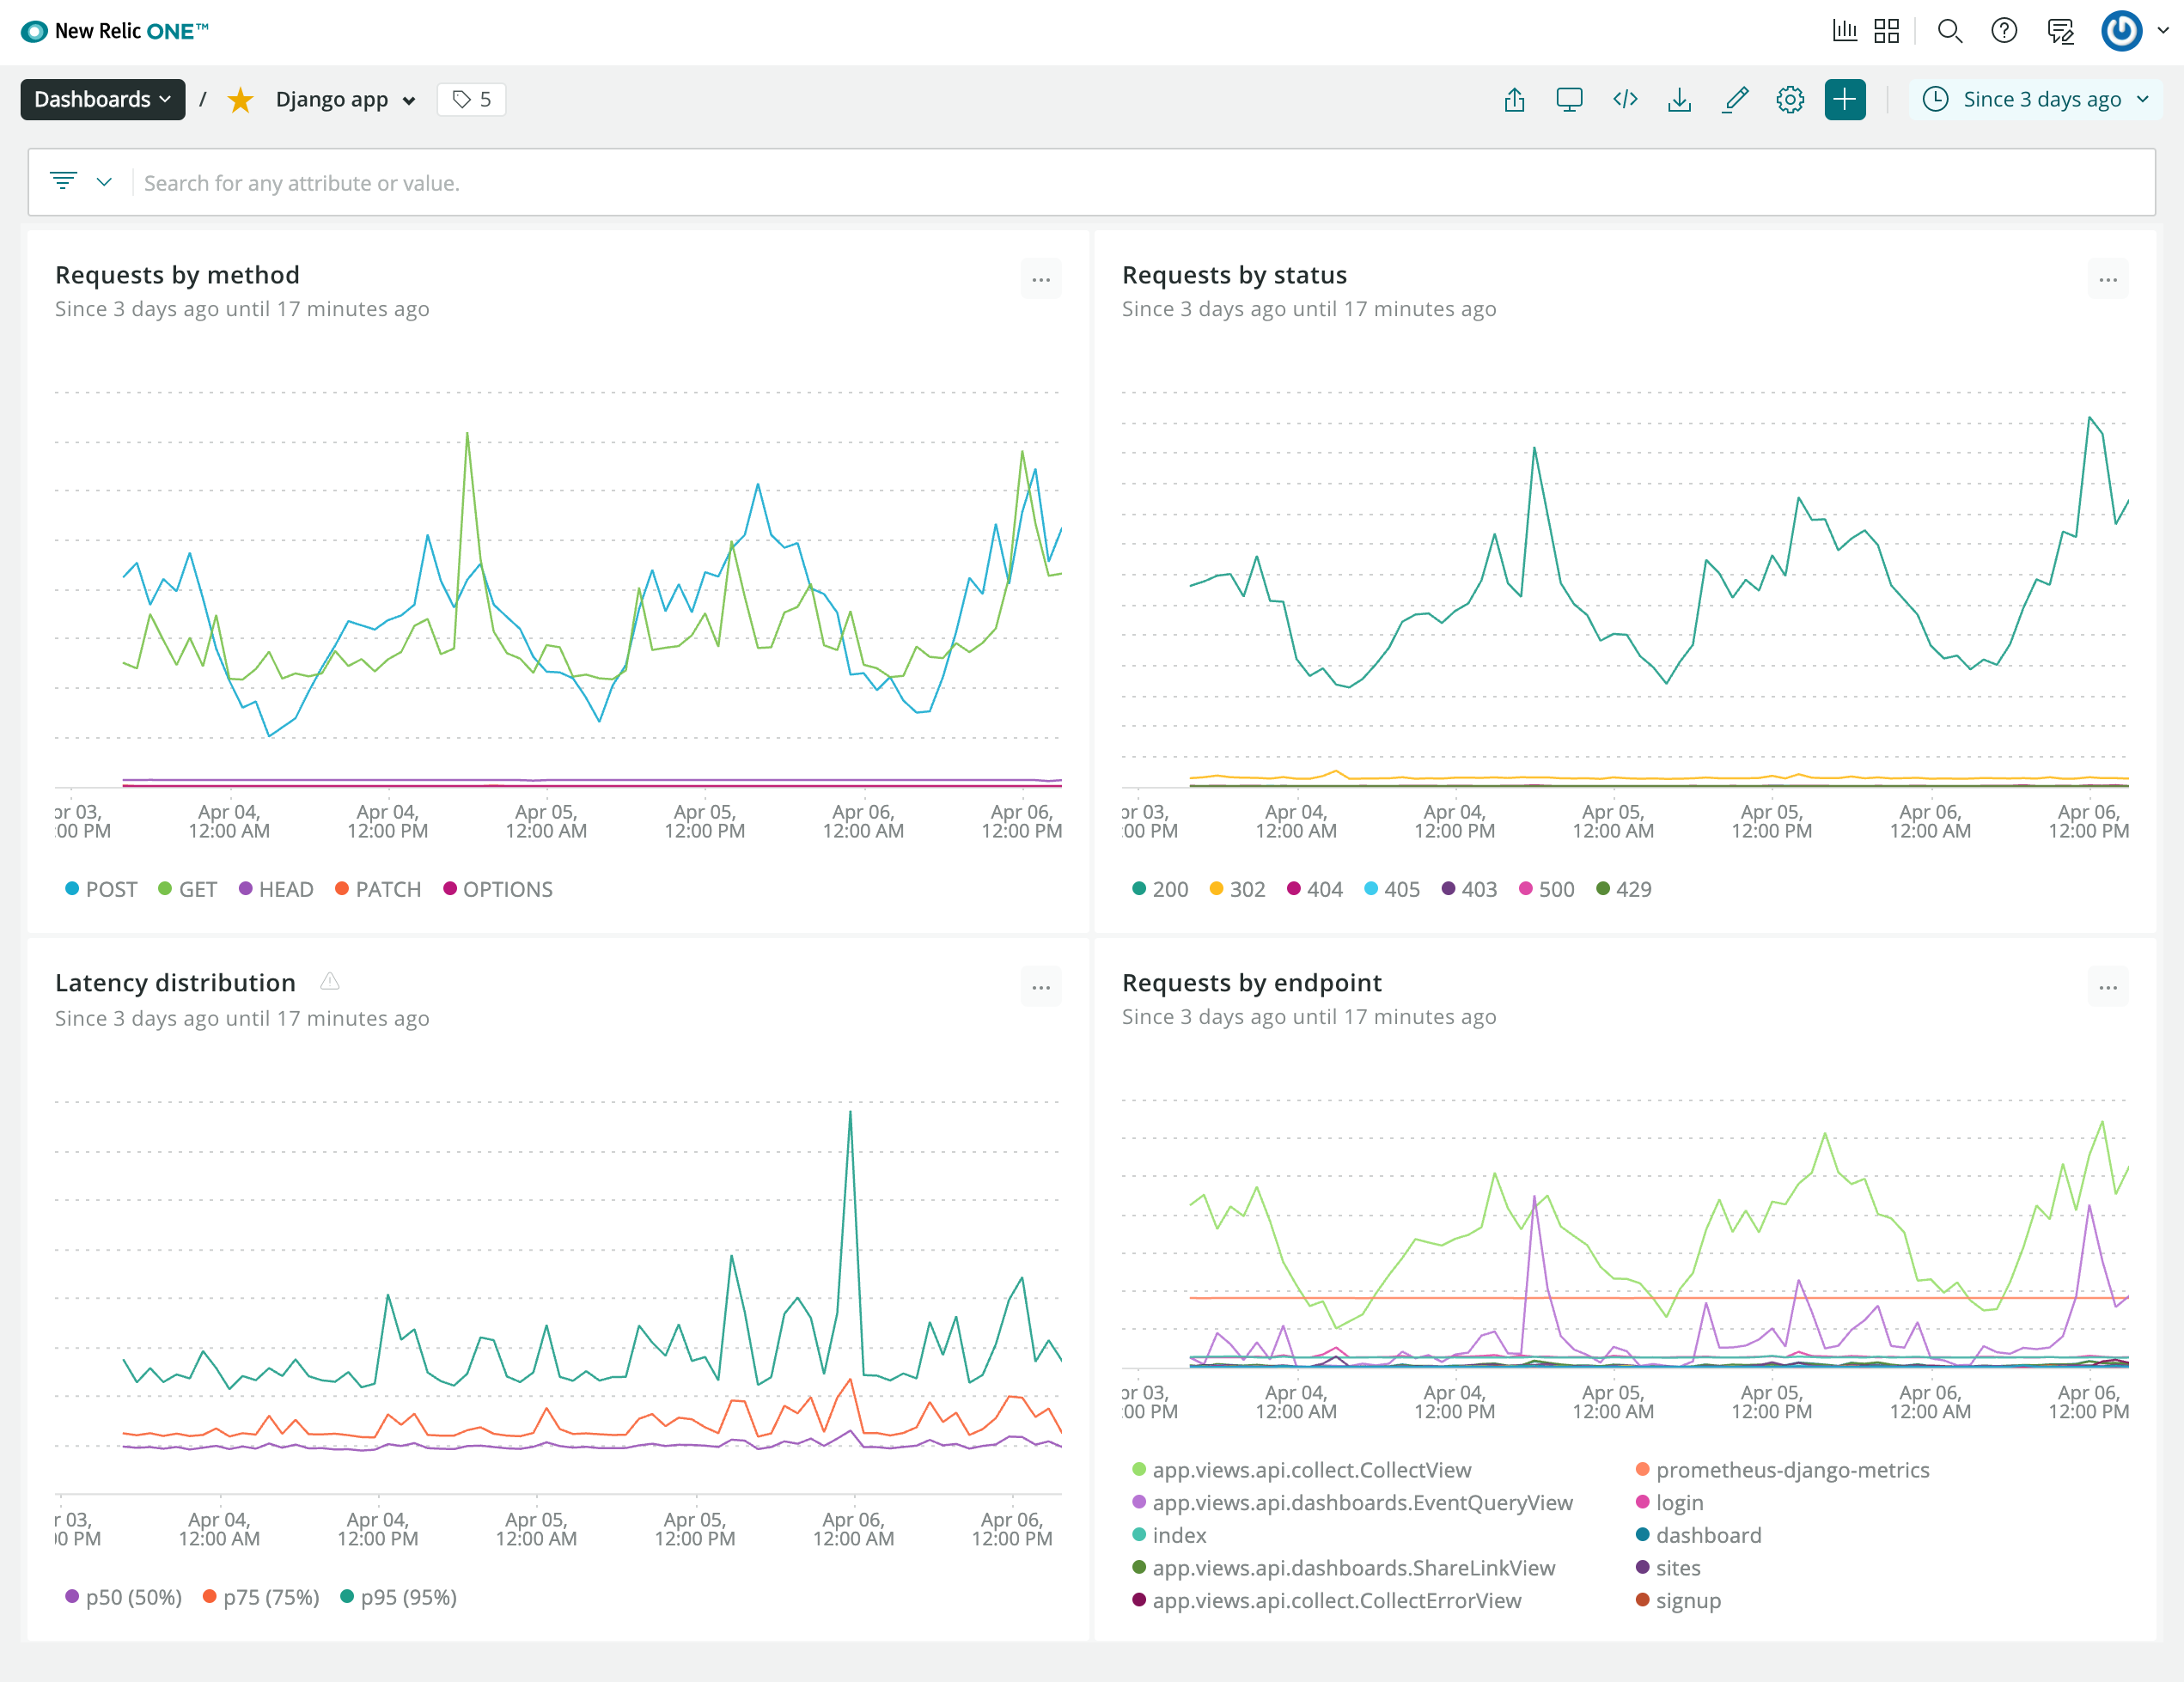 Example New Relic dashboard with a summary of the most important stats.
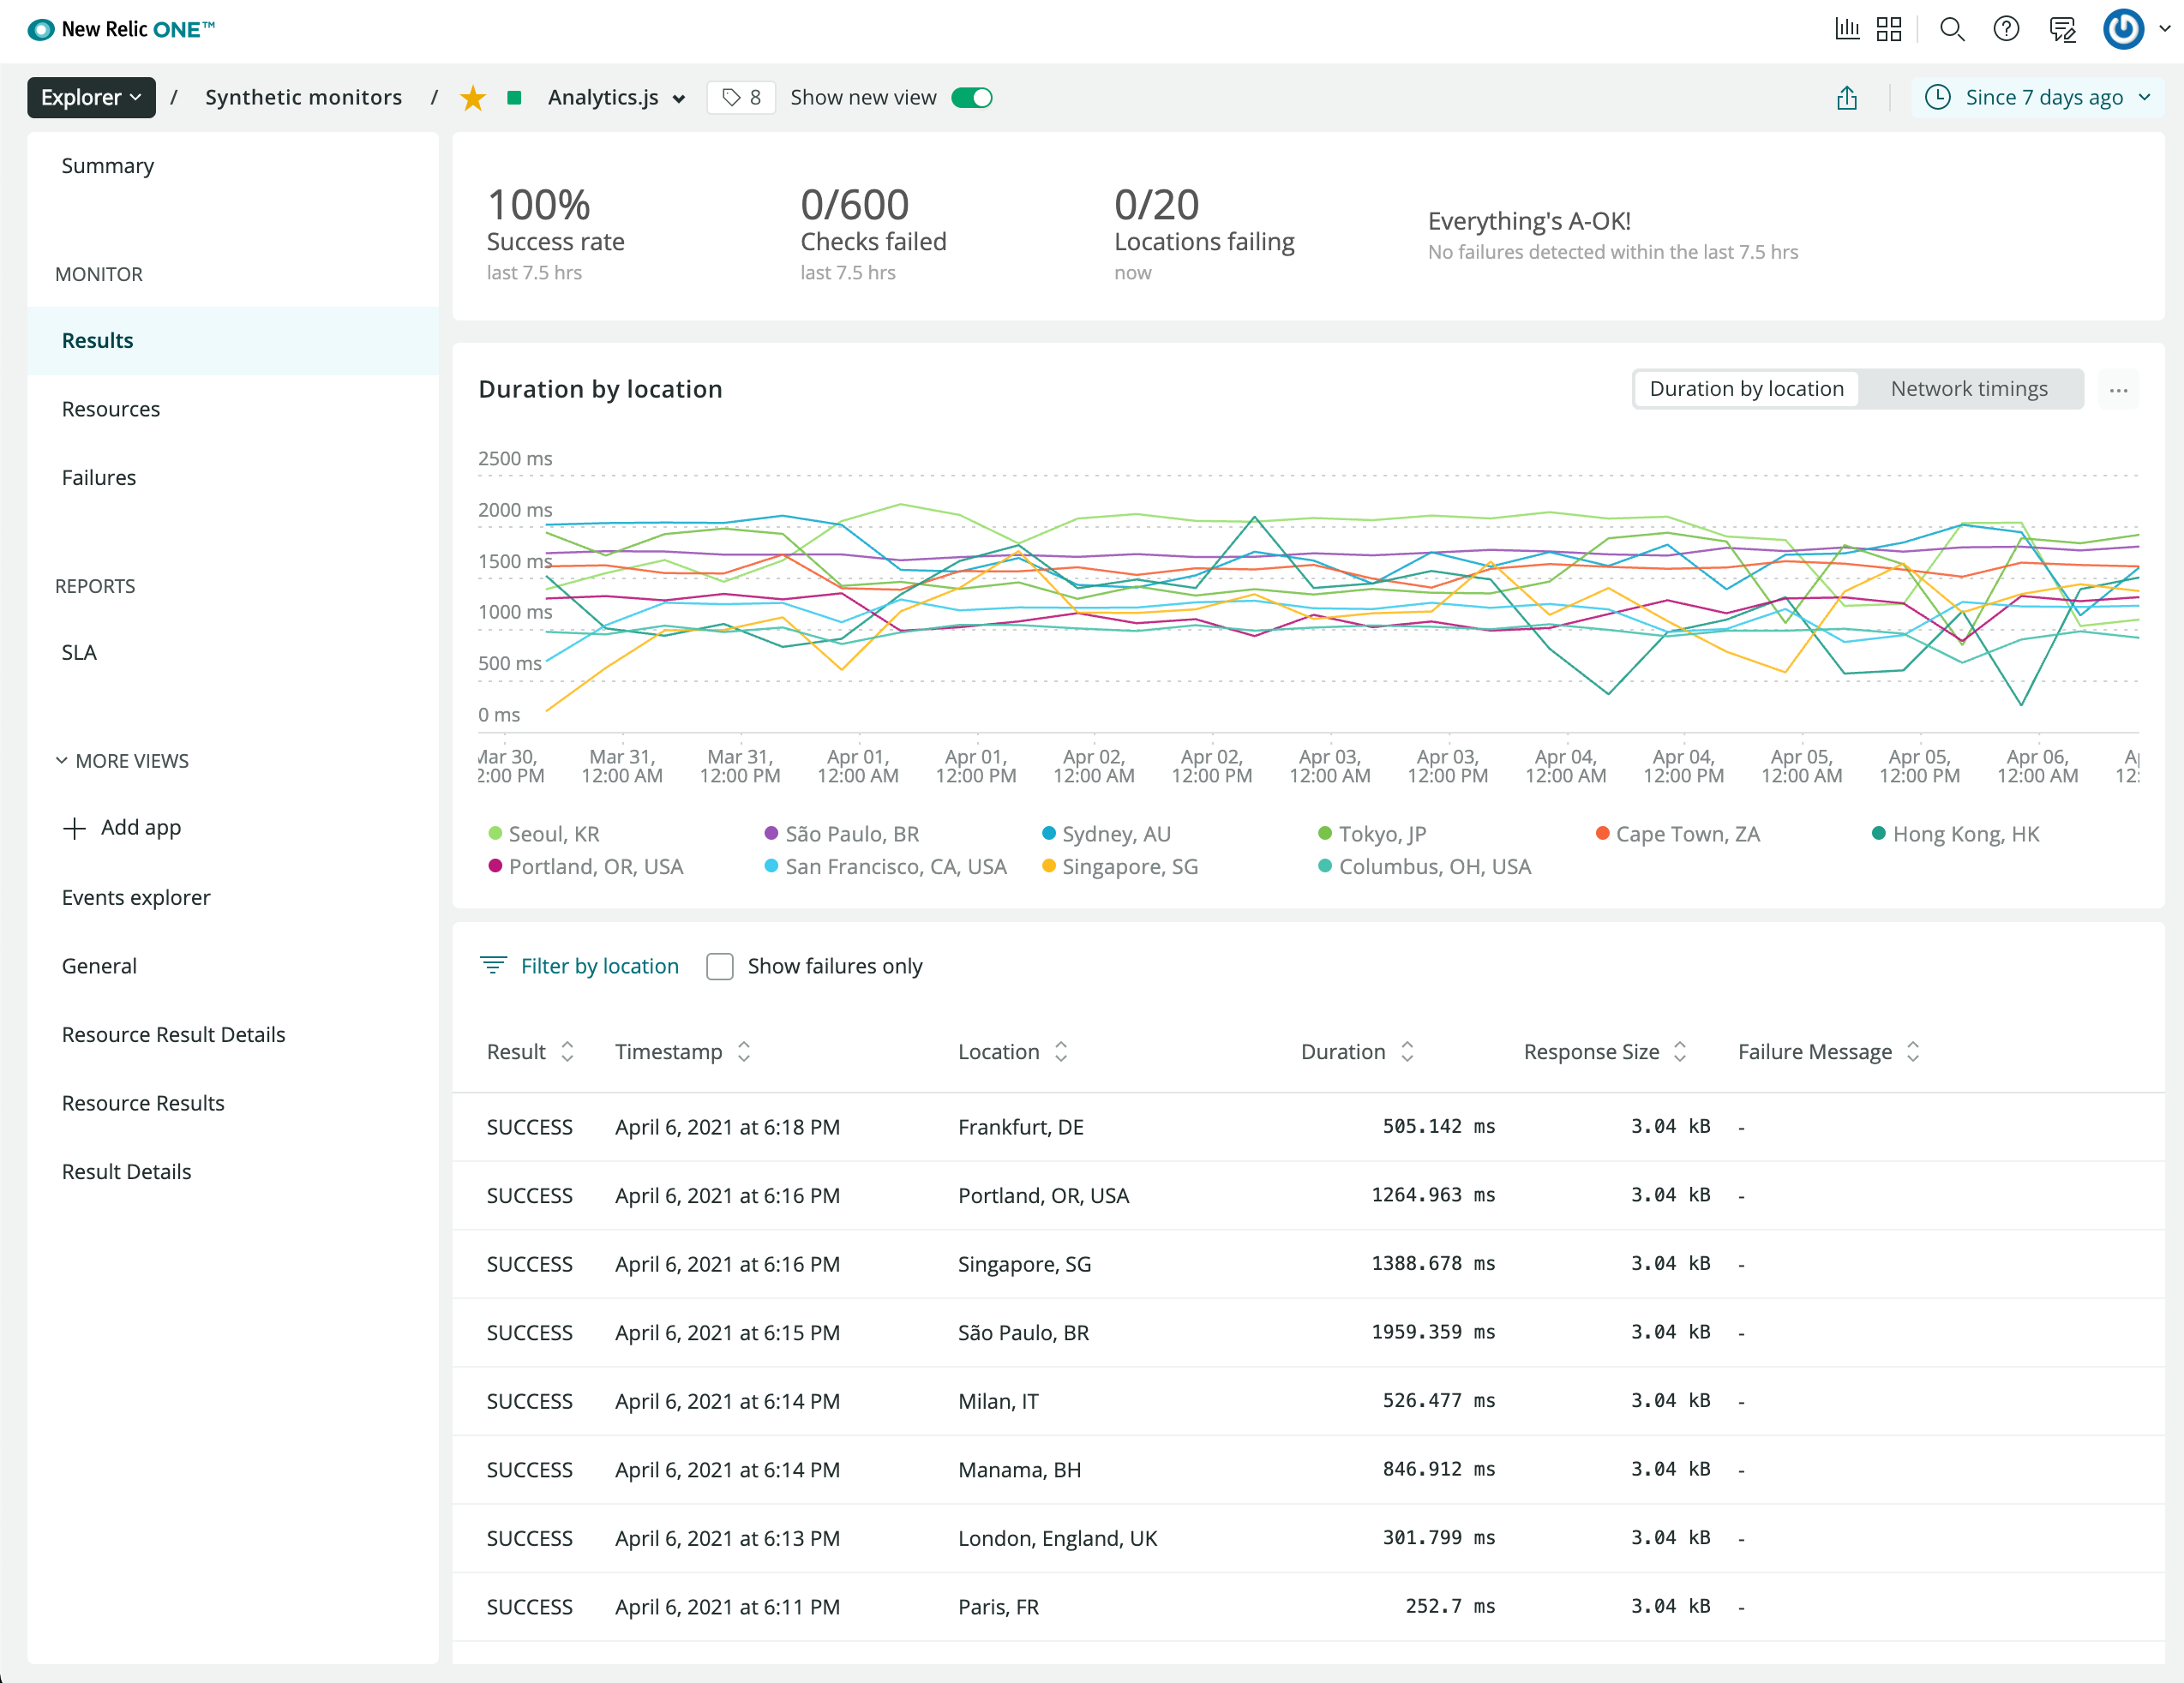 I also monitor uptime around the world using New Relic's probes.
The migration from a self-hosted Grafana/Loki/Prometheus stack to New Relic reduced my operational surface. More importantly, I'd still get alerted even if my AWS region is down.
You might be wondering how I expose metrics from my Django app. I leverage the excellent django-prometheus library, and simply register a new counter/gauge in my application:
from prometheus_client import Counter

EVENTS_WRITTEN = Counter(
 "events_total",
 "Total number of events written to the eventstore"
)

# We can increment the counter to record the number of events
# being written to the eventstore (ClickHouse)
EVENTS_WRITTEN.incr(count)
It will expose this and other metrics in the /metrics endpoint of my server (only reachable within my cluster). Prometheus will automatically scrape this endpoint every minute and forward the metrics to New Relic.
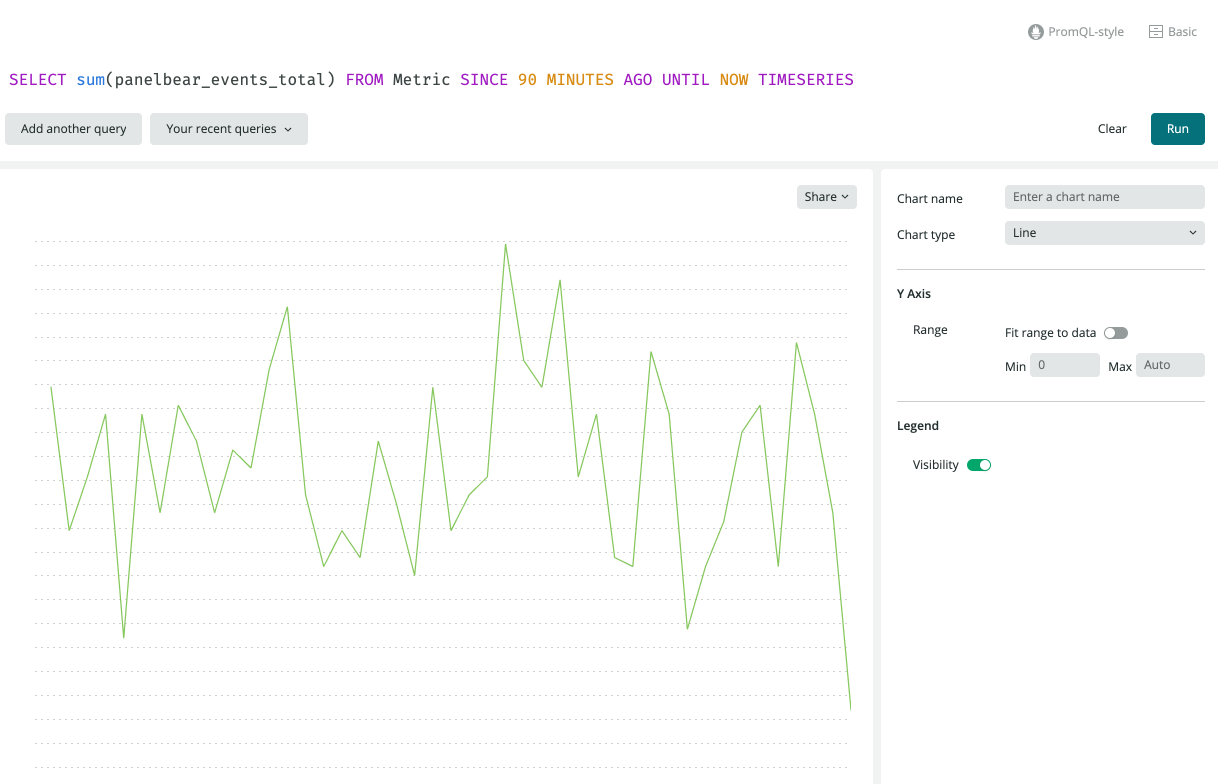 The metric automatically shows up in New Relic thanks to the Prometheus integration.
Error tracking
Everyone thinks they don’t have errors in their application, until they start error tracking. It’s too easy for an exception to get lost in logs, or worse you’re aware of it but unable to reproduce the problem due to lack of context.
I use Sentry to aggregate and notify me about errors across my applications. Instrumenting my Django apps is very simple:
SENTRY_DSN = env.str("SENTRY_DSN", default=None)

# Init Sentry if configured
if SENTRY_DSN:
 sentry_sdk.init(
   dsn=SENTRY_DSN,
   integrations=[DjangoIntegration(), RedisIntegration(), CeleryIntegration()],
   # Do not send user PII data to Sentry
   # See also inbound rules for special patterns
   send_default_pii=False,
   # Only sample a small amount of performance traces
   traces_sample_rate=env.float("SENTRY_TRACES_SAMPLE_RATE", default=0.008),
 )
It’s been very helpful because it automatically collects a bunch of contextual information about what happened when the exception occurred:
![]() Sentry aggregates and notifies me in case of exceptions.
Sentry aggregates and notifies me in case of exceptions.
I use a Slack #alerts channel to centralize all my alerts: downtime, cron job failures, security alerts, performance regressions, application exceptions, and whatnot. It's great because I can often correlate issues when multiple services ping me around the same time, on seemingly unrelated problems.
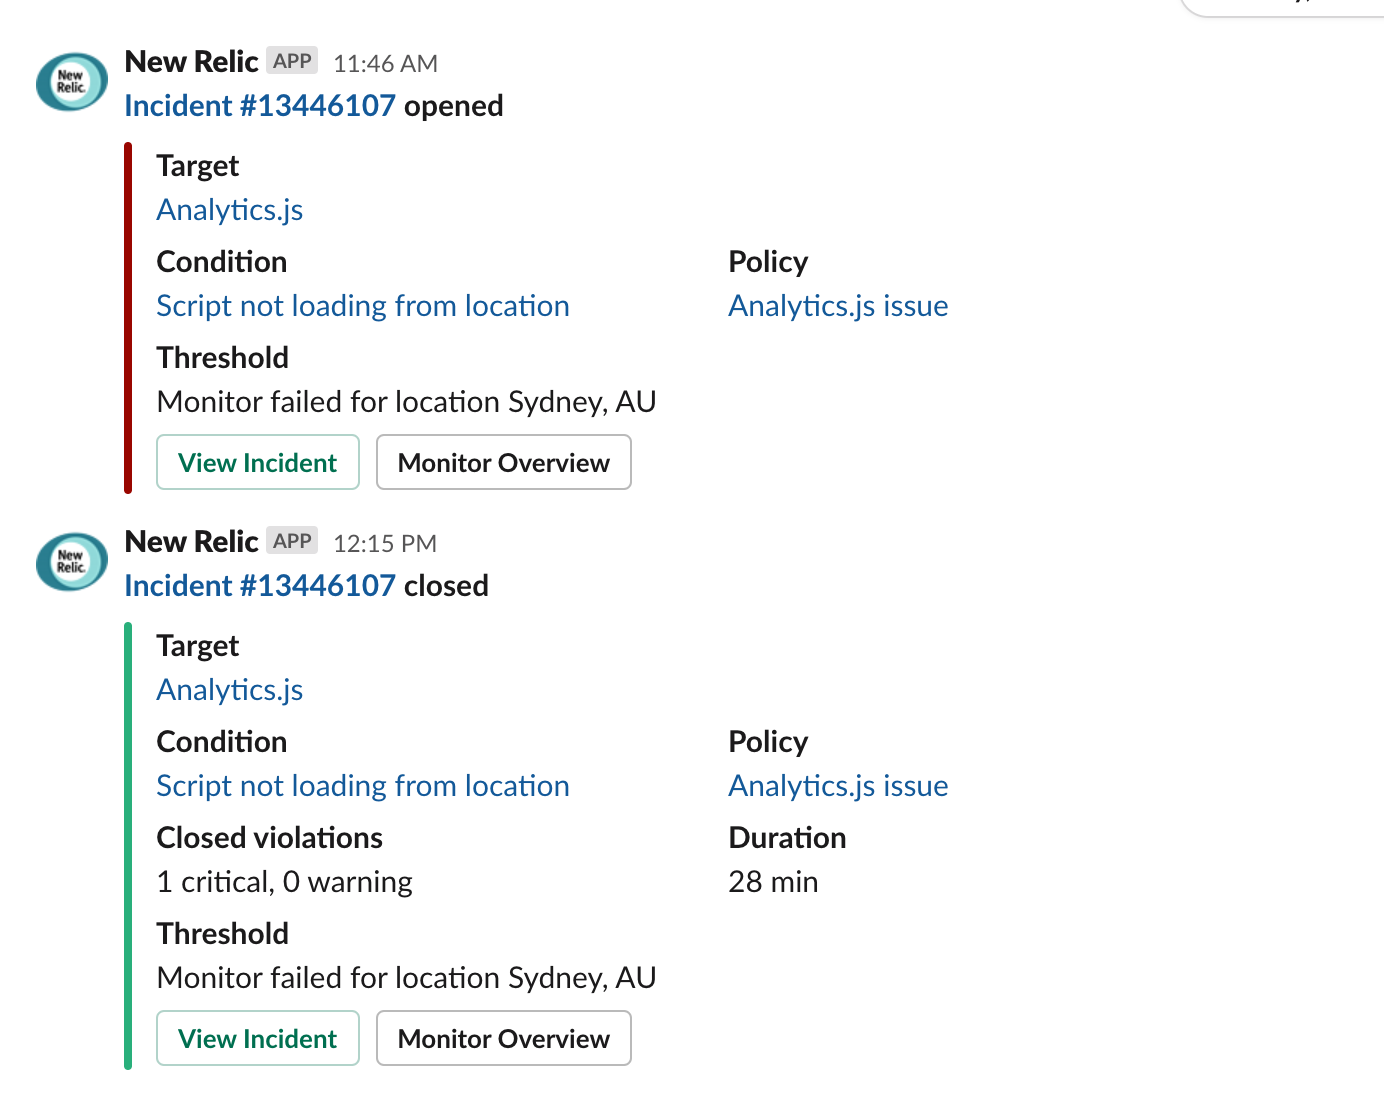 Example Slack alert due to a CDN endpoint being down in Sydney, Australia.
Profiling and other goodies
When I need to deep dive, I also use tools like cProfile and snakeviz to better understand allocations, number of calls and other stats about my app’s performance. Sounds fancy but they’re pretty easy to use tools, and have helped me identify various issues in the past that made my dashboards slow from seemingly unrelated code.
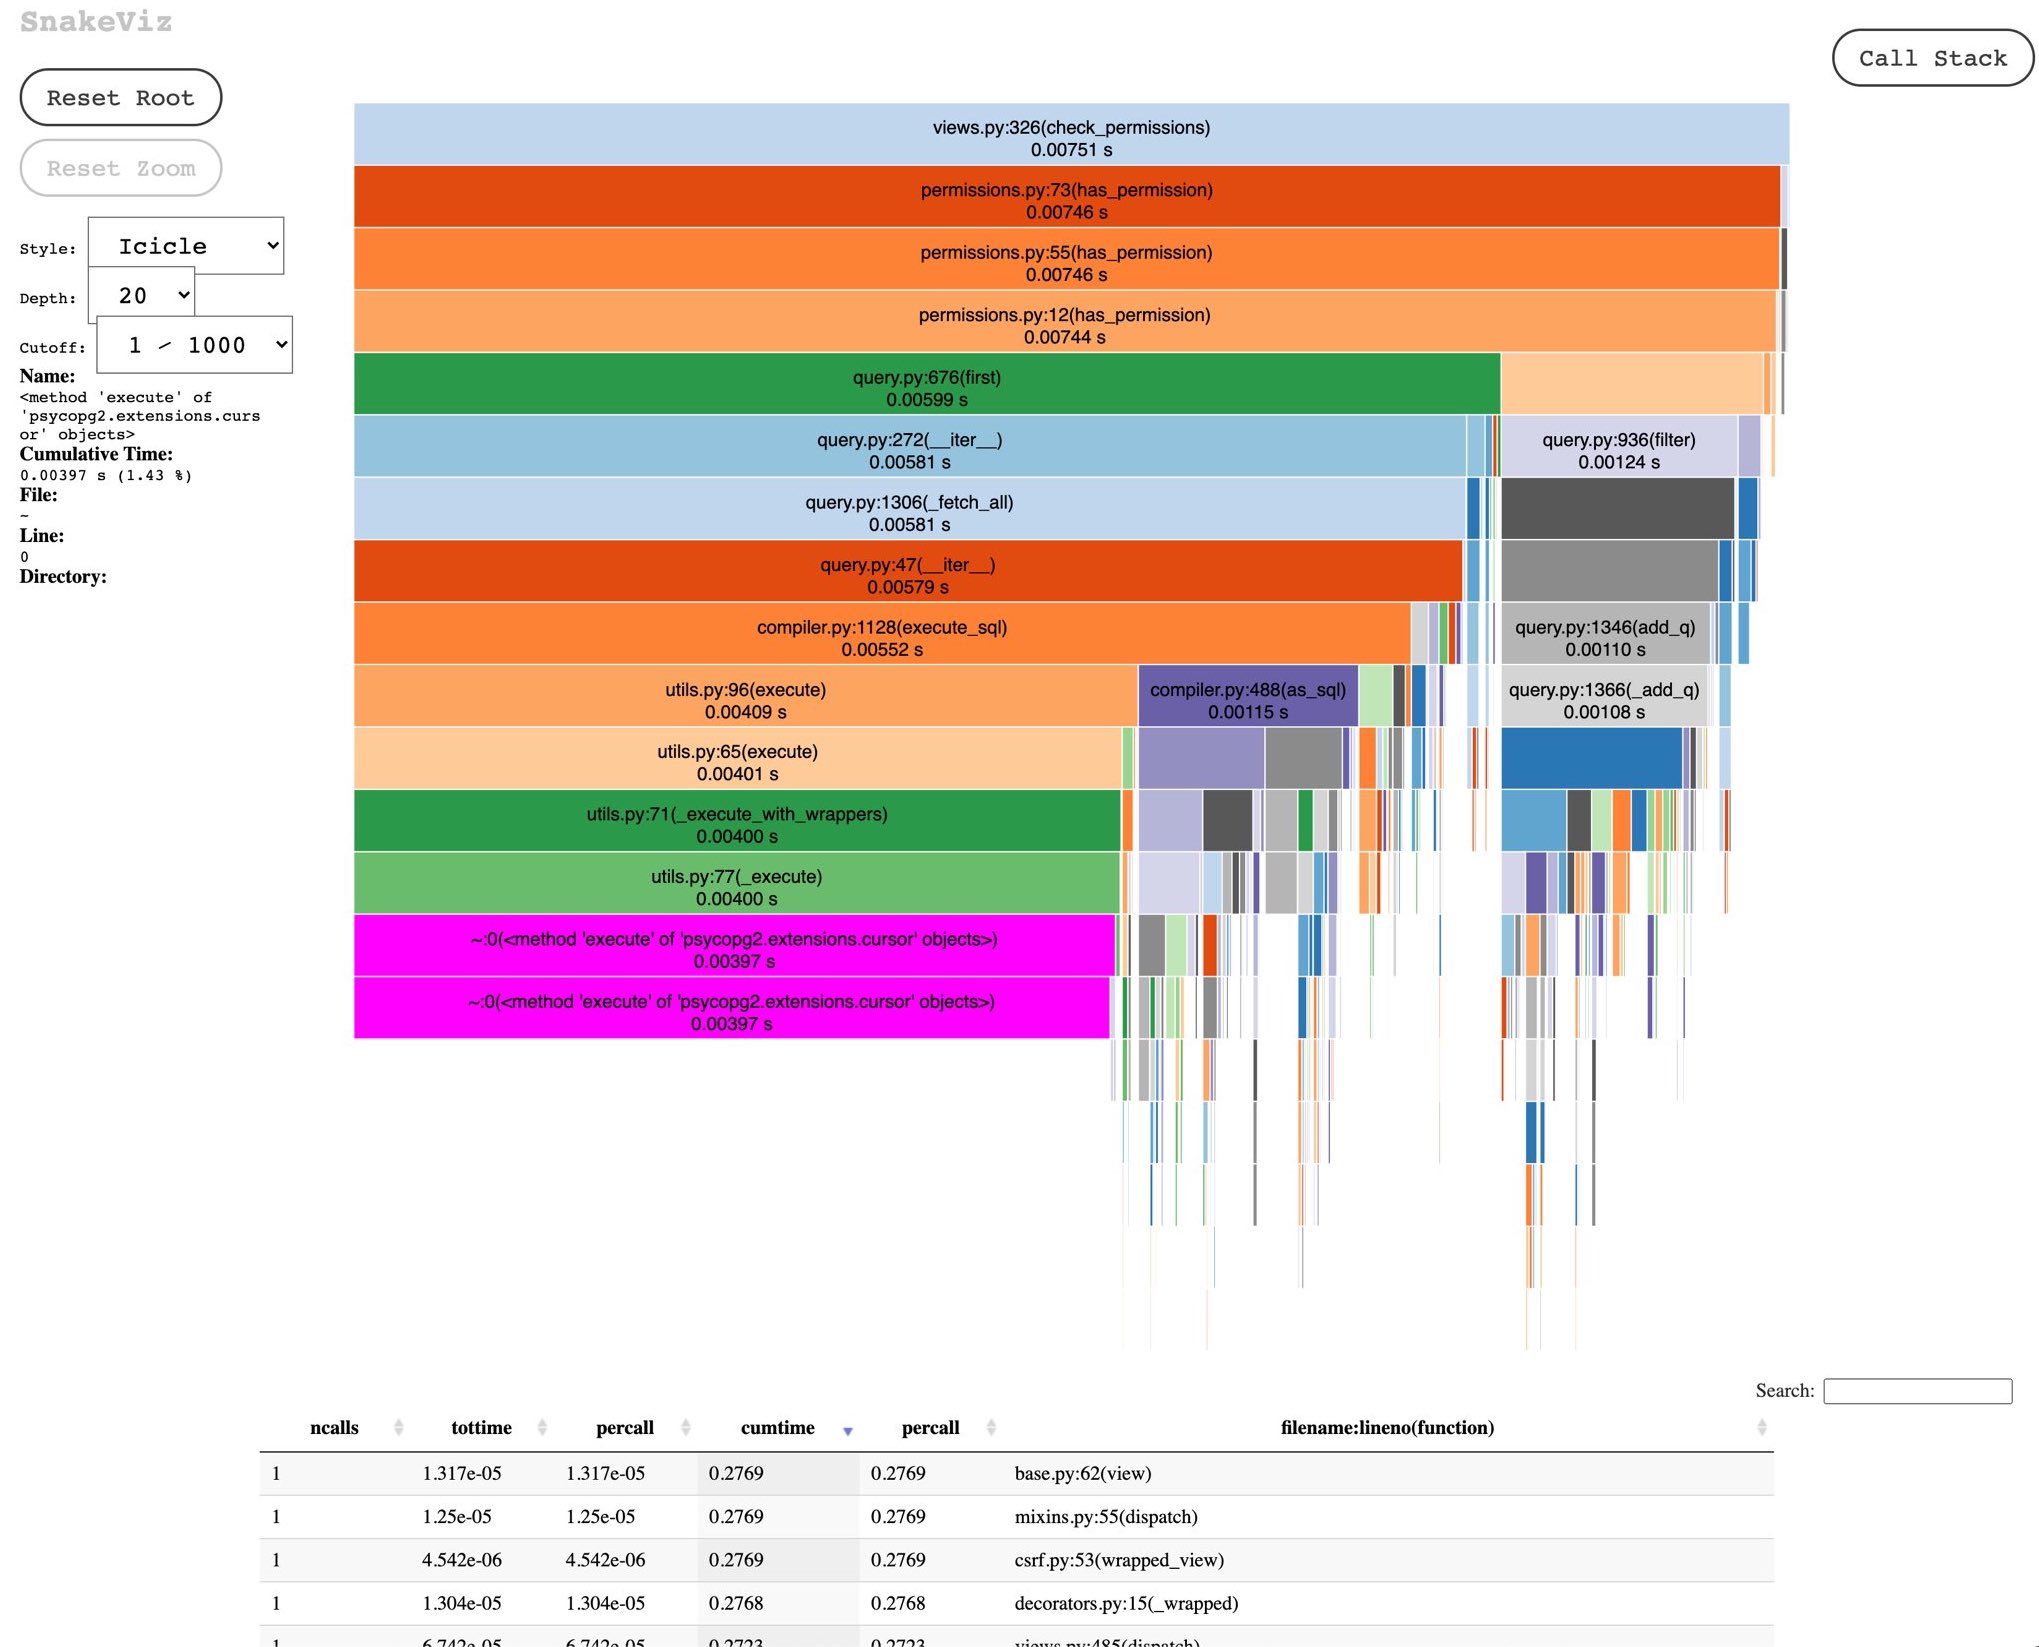 cProfile and snakeviz are great tools to profile your Python code locally.
I also use the Django debug toolbar on my local machine to easily inspect the queries that a view triggers, preview outgoing emails during development, and many other goodies.
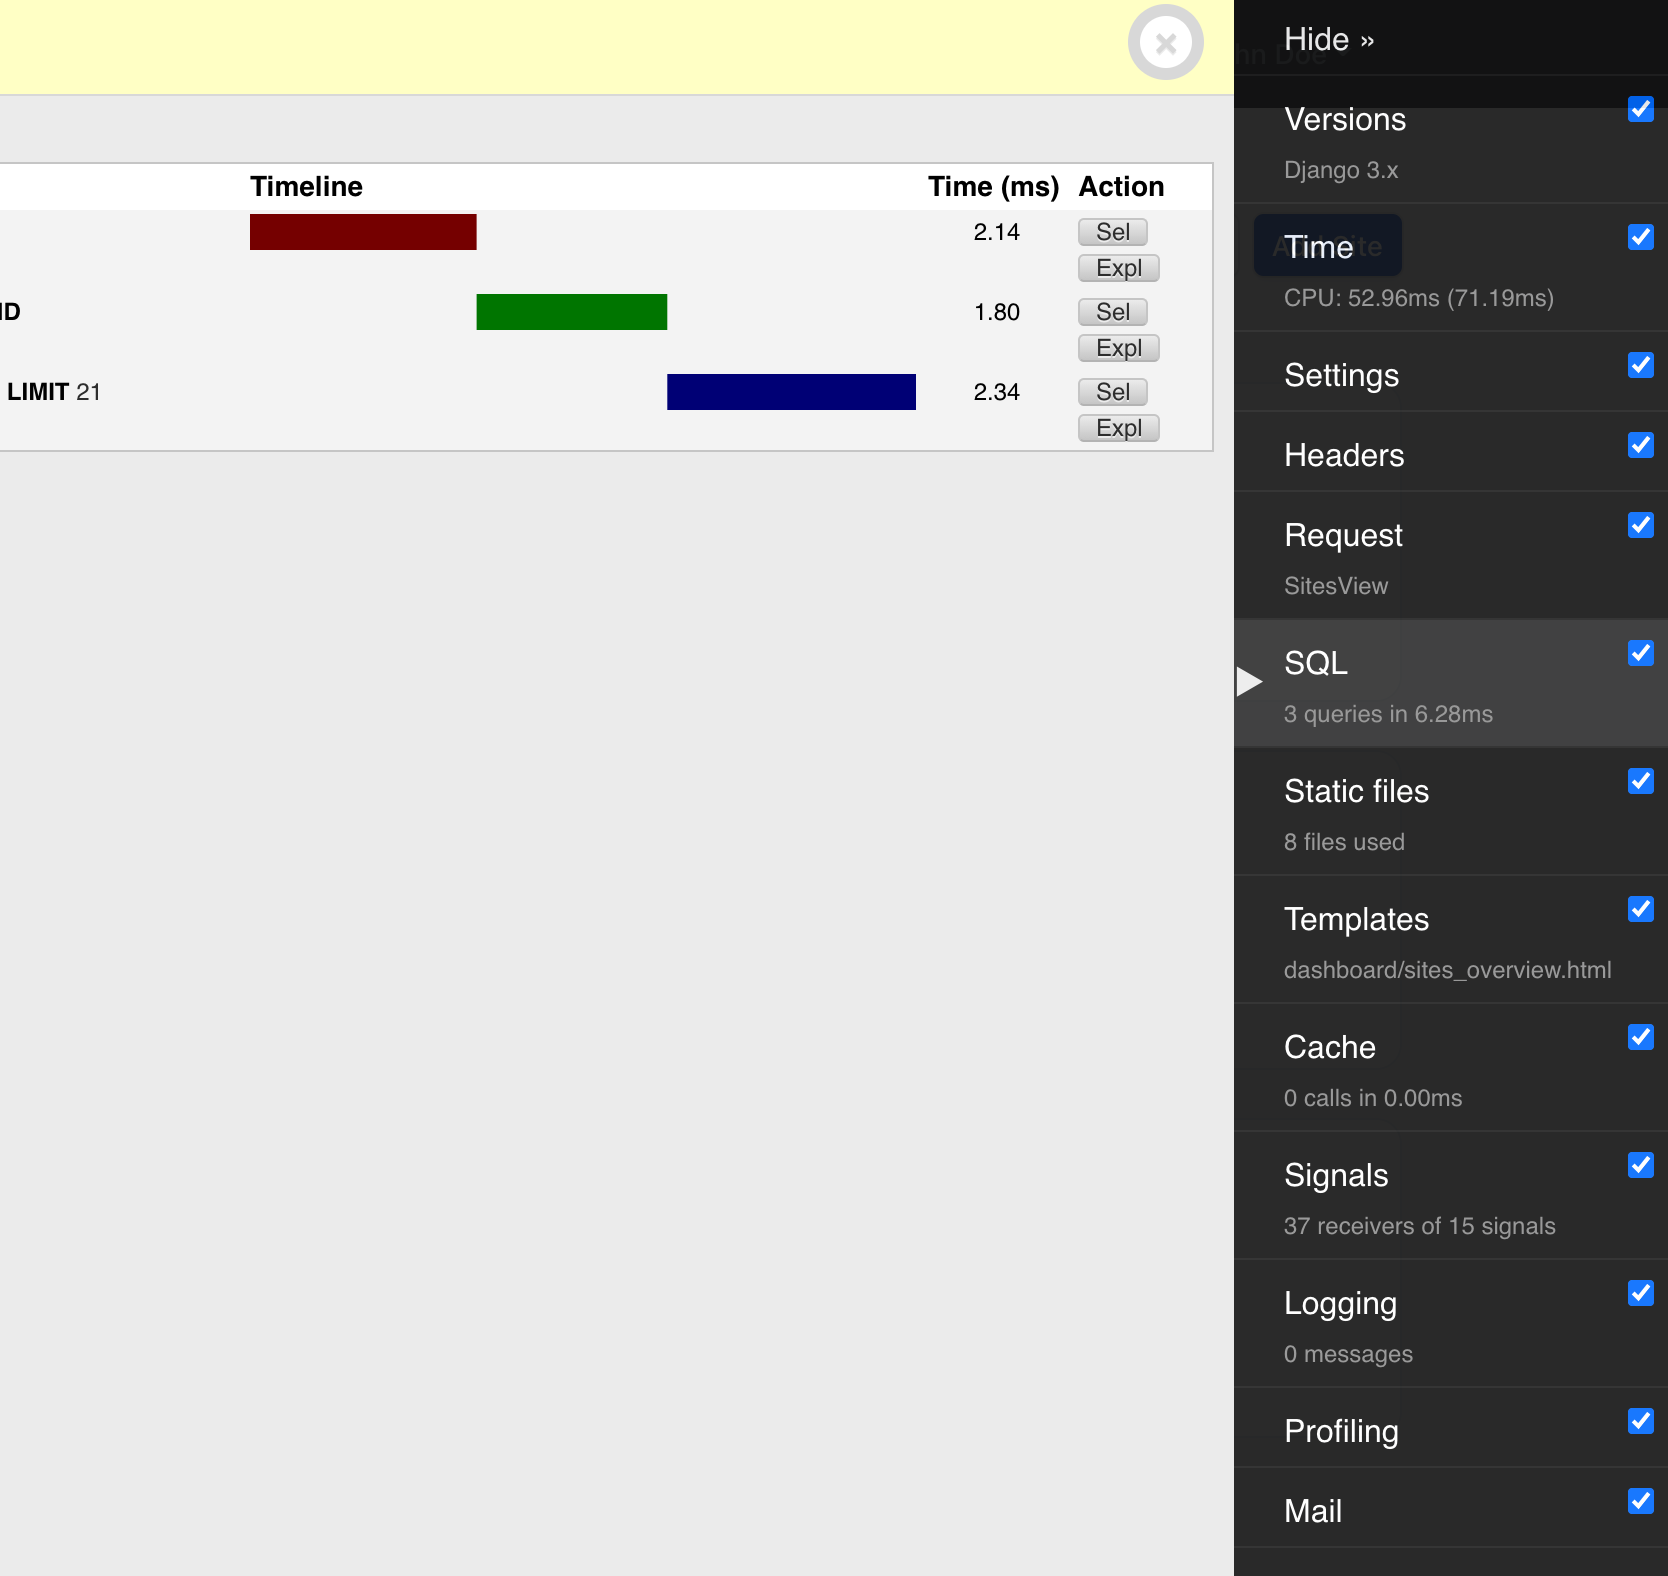 Django's Debug Toolbar is great for inspecting stuff in local dev, and previewing transactional emails.
That's all folks
I hope you enjoyed this post if you've made it this far. It ended up being a lot longer than I originally intended as there was a lot of ground to cover.
If you're not already familiar with these tools consider using a managed platform first, for example Render or Railway. This might help you focus on your product, and still gain many of the benefits I talk about here.
"Do you use Kubernetes for everything?" - No, different projects, different needs. For example this blog is hosted on Vercel.
That said, I do intend to write more follow up posts on specific tips and tricks, and share more lessons learned along the way.
You can find me on X